The New Global Data Center Map in the AI Era
AI compute demand is reshaping the global data center landscape at an unprecedented pace. In Q3 2025 alone, global hyperscale leasing volume reached 7.4 GW — exceeding the entire 2024 total of 7 GW. Vacancy rates across major North American markets have plunged to a record-low 1.6%, while global construction costs have climbed to an average of $10.7M/MW. From Northern Virginia to Johor, Frankfurt to Mumbai, an AI-driven infrastructure arms race is unfolding. The four largest hyperscalers (AWS, Google, Meta, Microsoft) are projected to spend a combined ~$413 billion in 2025 capex — an 84% year-over-year surge. Yet a "triple constraint" of power bottlenecks, community opposition, and tightening regulation is forcing the industry to disperse into secondary markets and pivot toward nuclear and renewable energy. This report draws on authoritative data from CBRE, JLL, Cushman & Wakefield, Knight Frank, DC Byte, and others to provide a comprehensive, city-level analysis of data center markets across North America, Europe, and Asia-Pacific.
Part I: North America — The Global Compute Engine at Full Stretch
Northern Virginia Still Reigns Supreme, but the Cost of Growth Is Rising
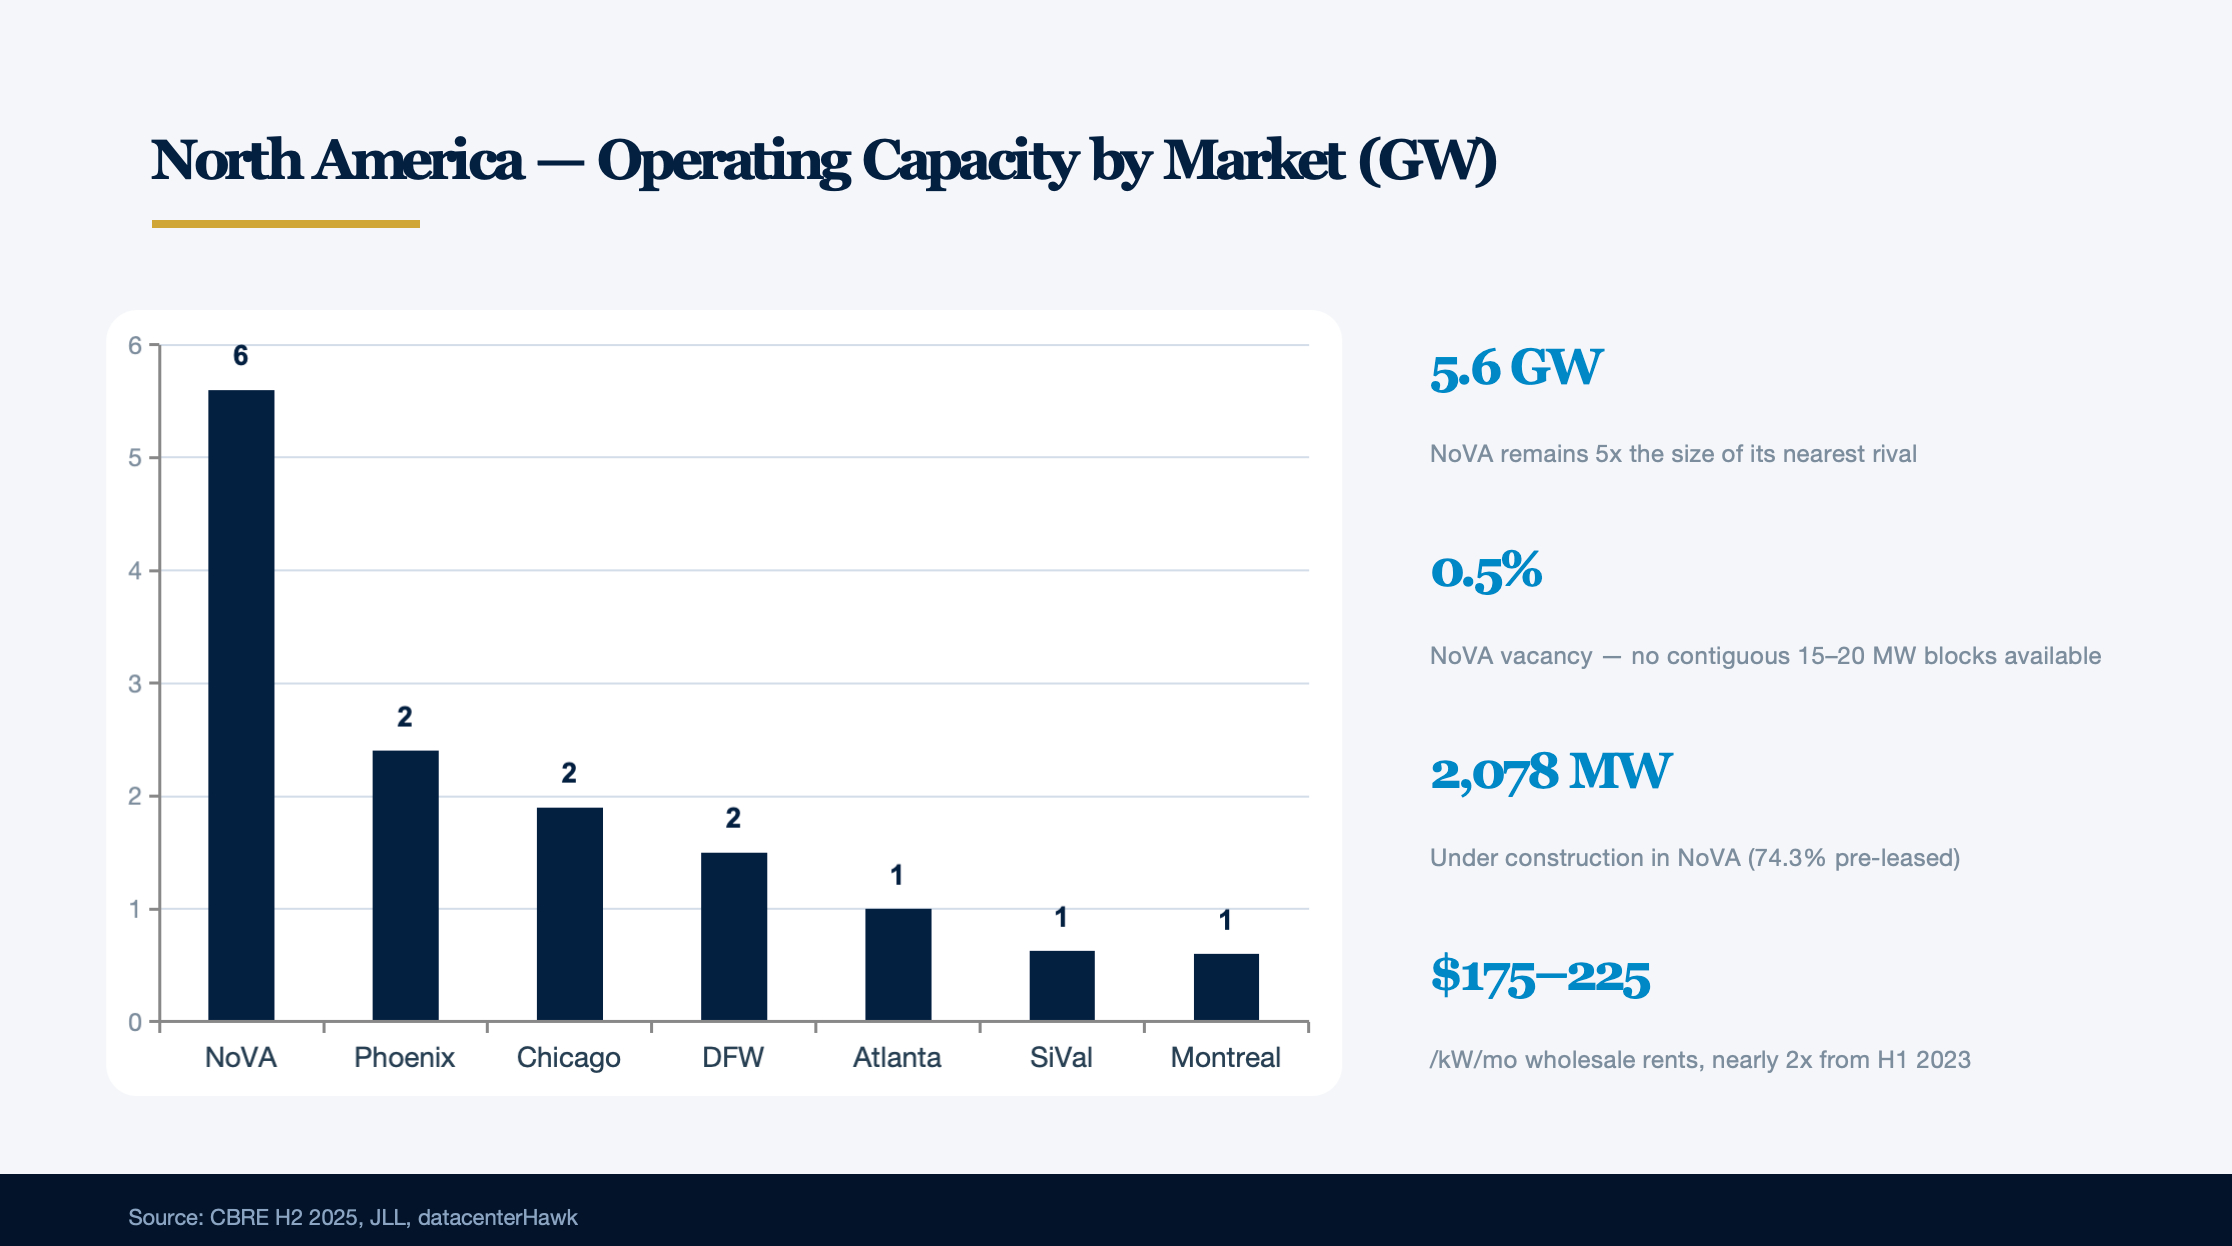
Northern Virginia (NoVA) remains the world's largest data center market at 5.6 GW of total capacity — five times the size of its nearest rival. Net absorption in 2025 reached 1,102 MW, leading all major markets. Yet this "Data Center Capital" faces unprecedented pressure.
Supply-demand at breaking point. CBRE data shows colocation vacancy fell to just 0.5% in H2 2025, with no contiguous blocks of 15–20 MW available anywhere in the market. Under-construction capacity stands at 2,078 MW (up 80% YoY), but 74.3% is already pre-leased, with signed power agreements extending through 2026–2028. Wholesale rents have soared to $175–$225/kW/month, nearly doubling from the $90–$110 range seen in H1 2023. Data center land prices have breached $8 million per acre, compared with $200K–$300K for other land in the same area.
Dominion Energy grid queue hits record levels. As of October 2025, data center-related power applications total 47.1 GW — more than double Dominion's historical peak load of 23 GW. Filings submitted in February 2025 show pending applications with no confirmed interconnection date reaching approximately 70 GW. Individual campus applications have scaled from a typical 30 MW to 300 MW or even multi-GW levels. Dominion projects an 85% load increase over 15 years, requiring 3.4 GW of offshore wind, 12 GW of solar, and 4.5 GW of storage. Data centers already account for 21–24% of Virginia's total electricity sales.
Loudoun County ends by-right approvals. On March 18, 2025, Loudoun County voted 7:2 to amend its zoning rules, shifting data center construction from administrative approval to a Special Exception (SPEX) process — requiring public hearings before the Planning Commission and Board of Supervisors. The change is expected to add 12–24 months to approval timelines. Nonetheless, data centers still contribute roughly half the county's property tax revenue, with FY2025 collections of approximately $895 million, generating $26 in tax revenue for every $1 of public services consumed.
The southern corridor accelerates. Vantage is developing a $2 billion, 929,000 sq ft campus in Stafford County. STACK Infrastructure has planned a 1 GW Stafford Technology Campus spanning 500 acres with 19 buildings and 300 MW of battery storage. CleanArc has broken ground on a 900 MW campus in Caroline County, while PowerHouse is constructing an 800 MW facility in Spotsylvania County. The I-95 corridor is extending southward from NoVA toward Richmond as a new data center belt.
Dallas–Fort Worth Emerges as North America's Second-Largest Market
DFW has grown to 1.5 GW of total capacity, making it North America's second-largest market. JLL projects the market will double by end of 2026. Net absorption in 2025 reached 470.8 MW (up 424 MW YoY), while vacancy dropped below 1%.
Vantage Frontier is the market's marquee development — announced in August 2025, located in Shackelford County, roughly 125 miles west of Fort Worth. Total investment exceeds $25 billion, with 1.4 GW of capacity across 1,200 acres, 10 data centers, and 3.7 million sq ft, supporting 250+ kW ultra-high-density racks with liquid cooling. The first building is expected to deliver in H2 2026, linked to the Oracle/OpenAI Stargate project. Other major DFW projects include Crusoe and Blue Owl's $15 billion / 1.2 GW AI campus in Abilene, and Compass Red Oak's 350 MW development.
ERCOT grid — advantages and challenges. Oncor interconnection timelines of approximately 18 months are far faster than NoVA's 36 months or Silicon Valley's 5+ years. However, ERCOT interconnection applications have surged from 41 GW in early 2024 to 226 GW by November 2025, with roughly 73% attributable to data centers. Texas Senate Bill 6 requires new large loads to meet performance obligations during emergencies, with developers paying a $100K initial study fee.
Phoenix, Chicago, Silicon Valley, and Atlanta Each Carve Distinct Positions
Phoenix boasts a 4.2 GW pipeline — second nationally only to NoVA's 5.9 GW — with 1.3 GW under construction, the most of any market outside NoVA. Vacancy stands at 3% and rents at approximately $190/kW/month. Yet water constraints are intensifying: the Bureau of Reclamation cut Arizona's Colorado River allocation to 512,000 acre-feet/year in August 2024, amid the region's driest period in 1,200 years. Data centers consume 500,000 to 5 million gallons of water daily. The industry is accelerating adoption of waterless cooling. The largest planned development is the Vermaland campus in Pinal County: 3,300 acres, up to 3 GW, and a $33 billion investment.
Chicago operates 1.9 GW with 1.18 GW under construction and a record-low vacancy of 1.9%. ComEd's grid faces immense pressure: 75+ large load applications total over 28 GW (exceeding ComEd's historical peak of 24 GW), including 7 projects requesting 1 GW each. Power delivery is delayed to 2032 or later. Illinois industrial electricity at approximately 6.9¢/kWh remains competitive among major markets.
Silicon Valley / San Jose is the highest-rent data center market in the U.S. ($155–$250/kW/month), with power delivery expected to take 5+ years — the longest of any major market. PG&E has virtually no additional megawatt-scale capacity available in Santa Clara or San Jose. Land prices approach $4.4 million/acre, forcing developers into 3–4-story vertical builds. But its interconnection density remains irreplaceable — Equinix's Great Oaks campus is a critical cloud connectivity hub hosting AWS Direct Connect, Azure ExpressRoute, and Google Cloud Interconnect.
Atlanta was 2024's biggest breakout market — net absorption of 705.8 MW was 39 times the 2023 figure, surpassing NoVA for the first time. Total inventory grew 222% to 1,000.4 MW, with over 2,150 MW under construction. Georgia Power received regulatory approval for approximately 10 GW of new generation capacity ($16.3 billion investment), with 80% earmarked for data centers. AWS is investing $11 billion in Georgia, and QTS is planning a 615-acre campus in Fayetteville. Georgia offers a 100% sales tax exemption on server equipment investments exceeding $15 million. However, political winds are shifting — Clayton County has imposed a construction moratorium, and state legislators considered curtailing data center tax incentives in March 2026.
Secondary Markets Explode: Ohio, Mississippi, Indiana, Reno
Ohio is rising on the back of AEP's power infrastructure and its central geographic position. AEP Ohio's queue includes 50+ customers requesting over 30,000 MW. The largest project is SoftBank's Pike County $33 billion development (10 GW data center + 10 GW power plant). Amazon has invested over $11.3 billion in Ohio. AEP plans $72 billion in grid upgrades from 2026–2030.
Mississippi has attracted approximately $29 billion in investment — including AWS's $10 billion Madison County campus (1,713 acres, 16 buildings), Compass's $10 billion Meridian campus, and xAI's 1.2 GW Southaven project. The state offers 10-year/100% corporate income tax exemptions, sales tax incentives, and 30-year rolling abatements.
Indiana has secured over $31 billion in Amazon investment alone, including the $11 billion Project Rainier in New Carlisle (2.4 GW, 1,100 new jobs). Meta is investing $10 billion in a 1 GW campus in Lebanon. Indiana offers 35-year sales tax exemptions with a starting threshold of just $10 million — among the lowest in the nation.
Reno hosts Switch's Citadel campus (2,000 acres, 7.2M sq ft, 650 MW) alongside major projects from Apple, Google, and Vantage. Notably, Reno's construction cost of $15M/MW is the highest in the country, driven primarily by labor scarcity requiring workers to be imported from other regions.
Canada: Hydroelectric Advantage Powers Montreal's Rise
Canada's total IT capacity now exceeds 10 GW (including operational, under construction, committed, and early-stage). Three hubs — Toronto, Montreal, and Alberta — account for 93% of national IT load.
Montreal has emerged as an AI data center hotspot, leveraging Québec's hydroelectric advantage with industrial power rates locked at CAD 0.036–0.054/kWh (~$0.028–$0.042/kWh) — the lowest in North America. Operating costs run 40% below the Canadian national average. Over 600 MW of announced pipeline capacity is in the 2025 queue, with campus designs targeting 70 kW/rack densities for AI workloads.
Toronto holds 370+ MW of power capacity, representing approximately 40% of Canada's total. Alberta's Wonder Valley project (O'Leary Ventures, 5.6 GW) is the largest single development ever announced in Canada.
U.S. Policy Landscape: A Tug-of-War Between Incentives and Resistance
Tax incentive competition. At least 36–42 states have some form of data center tax incentive legislation. 37 states have enacted sales tax exemptions, with 16 states collectively granting nearly $6 billion in abatements over the past five years. Virginia's exemptions have ballooned from an initial $1.5M/year to $1.6 billion/year — a JLARC evaluation rated the program as delivering only "moderate economic benefit" and noted it "does not pay for itself." Texas is expected to exceed $1 billion in subsidies in 2025. A counter-trend is emerging: Virginia, Minnesota, Texas, and Georgia are all reconsidering or attaching conditions to their programs.
Community opposition at record levels. The Data Center Watch project tracked 142 grassroots groups (across 24 states) opposing data centers, growing to 188 groups (40 states) by Q2 2025. A cumulative $18 billion in projects have been directly blocked, and $46 billion delayed — a combined $64 billion. In Q2 2025 alone, $98 billion across 20 projects in 11 states were stalled. Project cancellations surged from 2 in 2023 to 25 in 2025. Core grievances include daily water consumption of 5 million gallons, permanent facilities creating only 15–100 jobs, noise levels reaching 100 decibels, and residential electricity rates rising 11.5% in 2025. Senator Bernie Sanders called for a national construction moratorium in December 2025.
The ADVANCE Act and nuclear energy. Signed in July 2024, the ADVANCE Act streamlines NRC licensing and sets a 25-month review deadline for new reactors at existing nuclear plant sites. A May 2025 executive order targets quadrupling nuclear capacity from 100 GW to 400 GW by 2050. Key nuclear-data center deals include: Talen Energy/Amazon's $18 billion / 1,920 MW / 17-year PPA (Susquehanna); Microsoft/Constellation's $1.6 billion / 835 MW / 20-year PPA (Three Mile Island restart, targeting 2028); and Meta's agreement with TerraPower for 8 Natrium reactors (2.6 GW nuclear + 1.2 GW storage). Google signed the first corporate SMR fleet deal with Kairos Power for 500 MW by 2035, with the first unit online by 2030. However, no SMRs are currently operational in the U.S. — the earliest commercial deployments are expected in the late 2020s or early 2030s.
North American AI-Driven Supply-Demand Dynamics: A Historic Inflection Point
Net absorption surges. Full-year 2025 net absorption across major markets reached 2,497.6 MW (CBRE); datacenterHawk's broader tracking scope shows 15+ GW. The 2024 full-year figure of approximately 4.4 GW (JLL) represented a fourfold increase from 2020. Under-construction pre-lease rates stand at 74.3% (CBRE), with pre-lease timelines extending 3–4 years out.
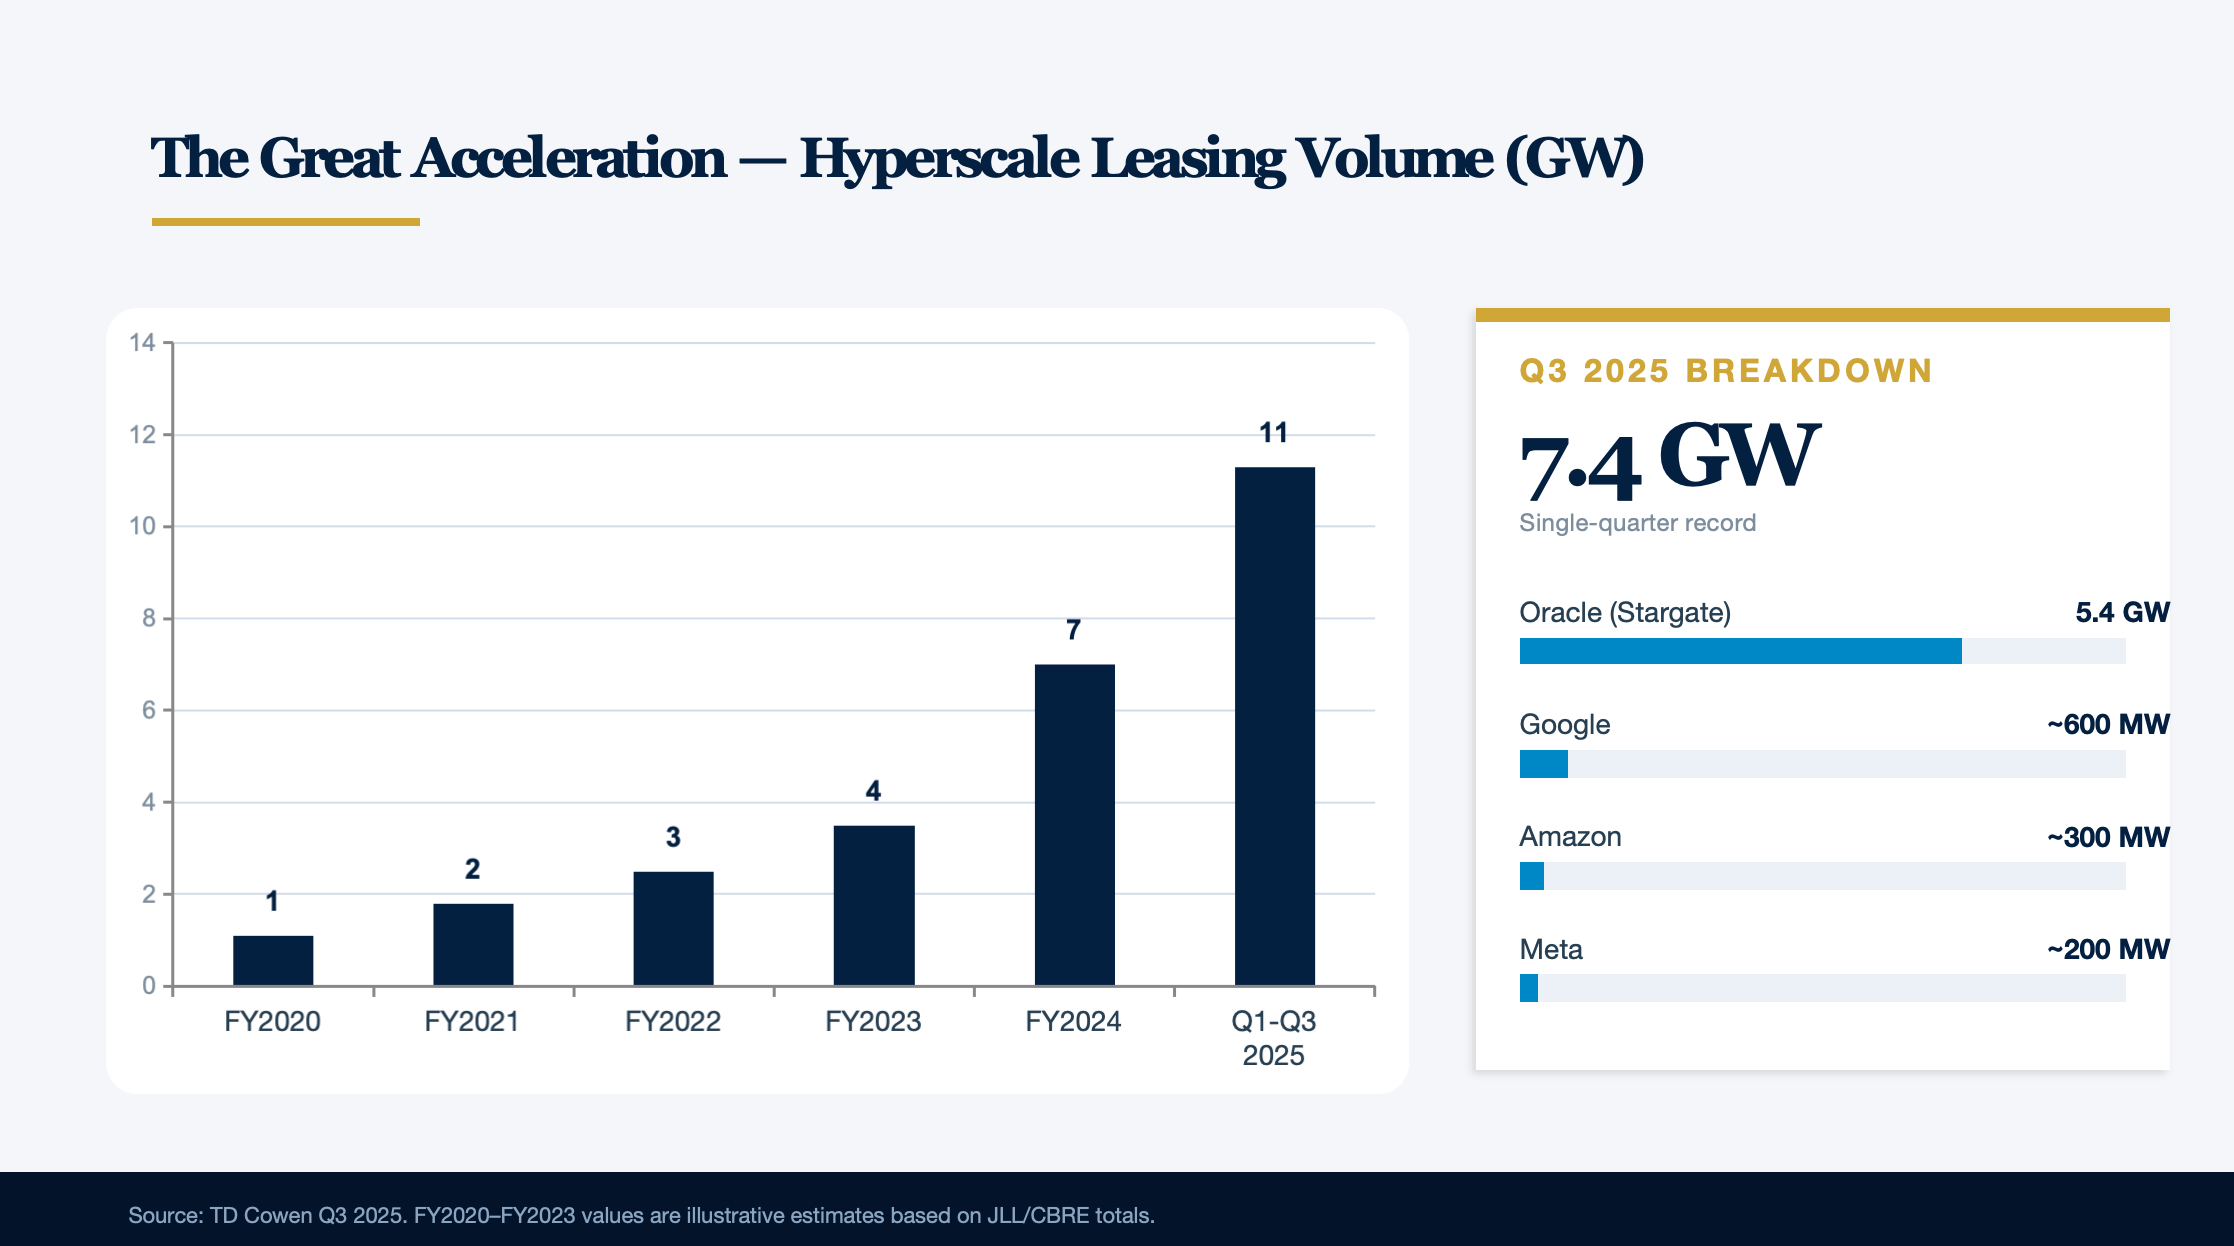
The "Great Acceleration" in hyperscale leasing. TD Cowen confirmed that Q3 2025 single-quarter leasing volume reached 7.4 GW — exceeding the full-year 2024 total of 7 GW. Oracle accounted for 5.4 GW (supporting Stargate), Google ~600 MW, Amazon ~300 MW, and Meta ~200 MW. The first three quarters of 2025 aggregated to 11.3 GW. TD Cowen called this "the most significant demand inflection since the data center industry's inception."
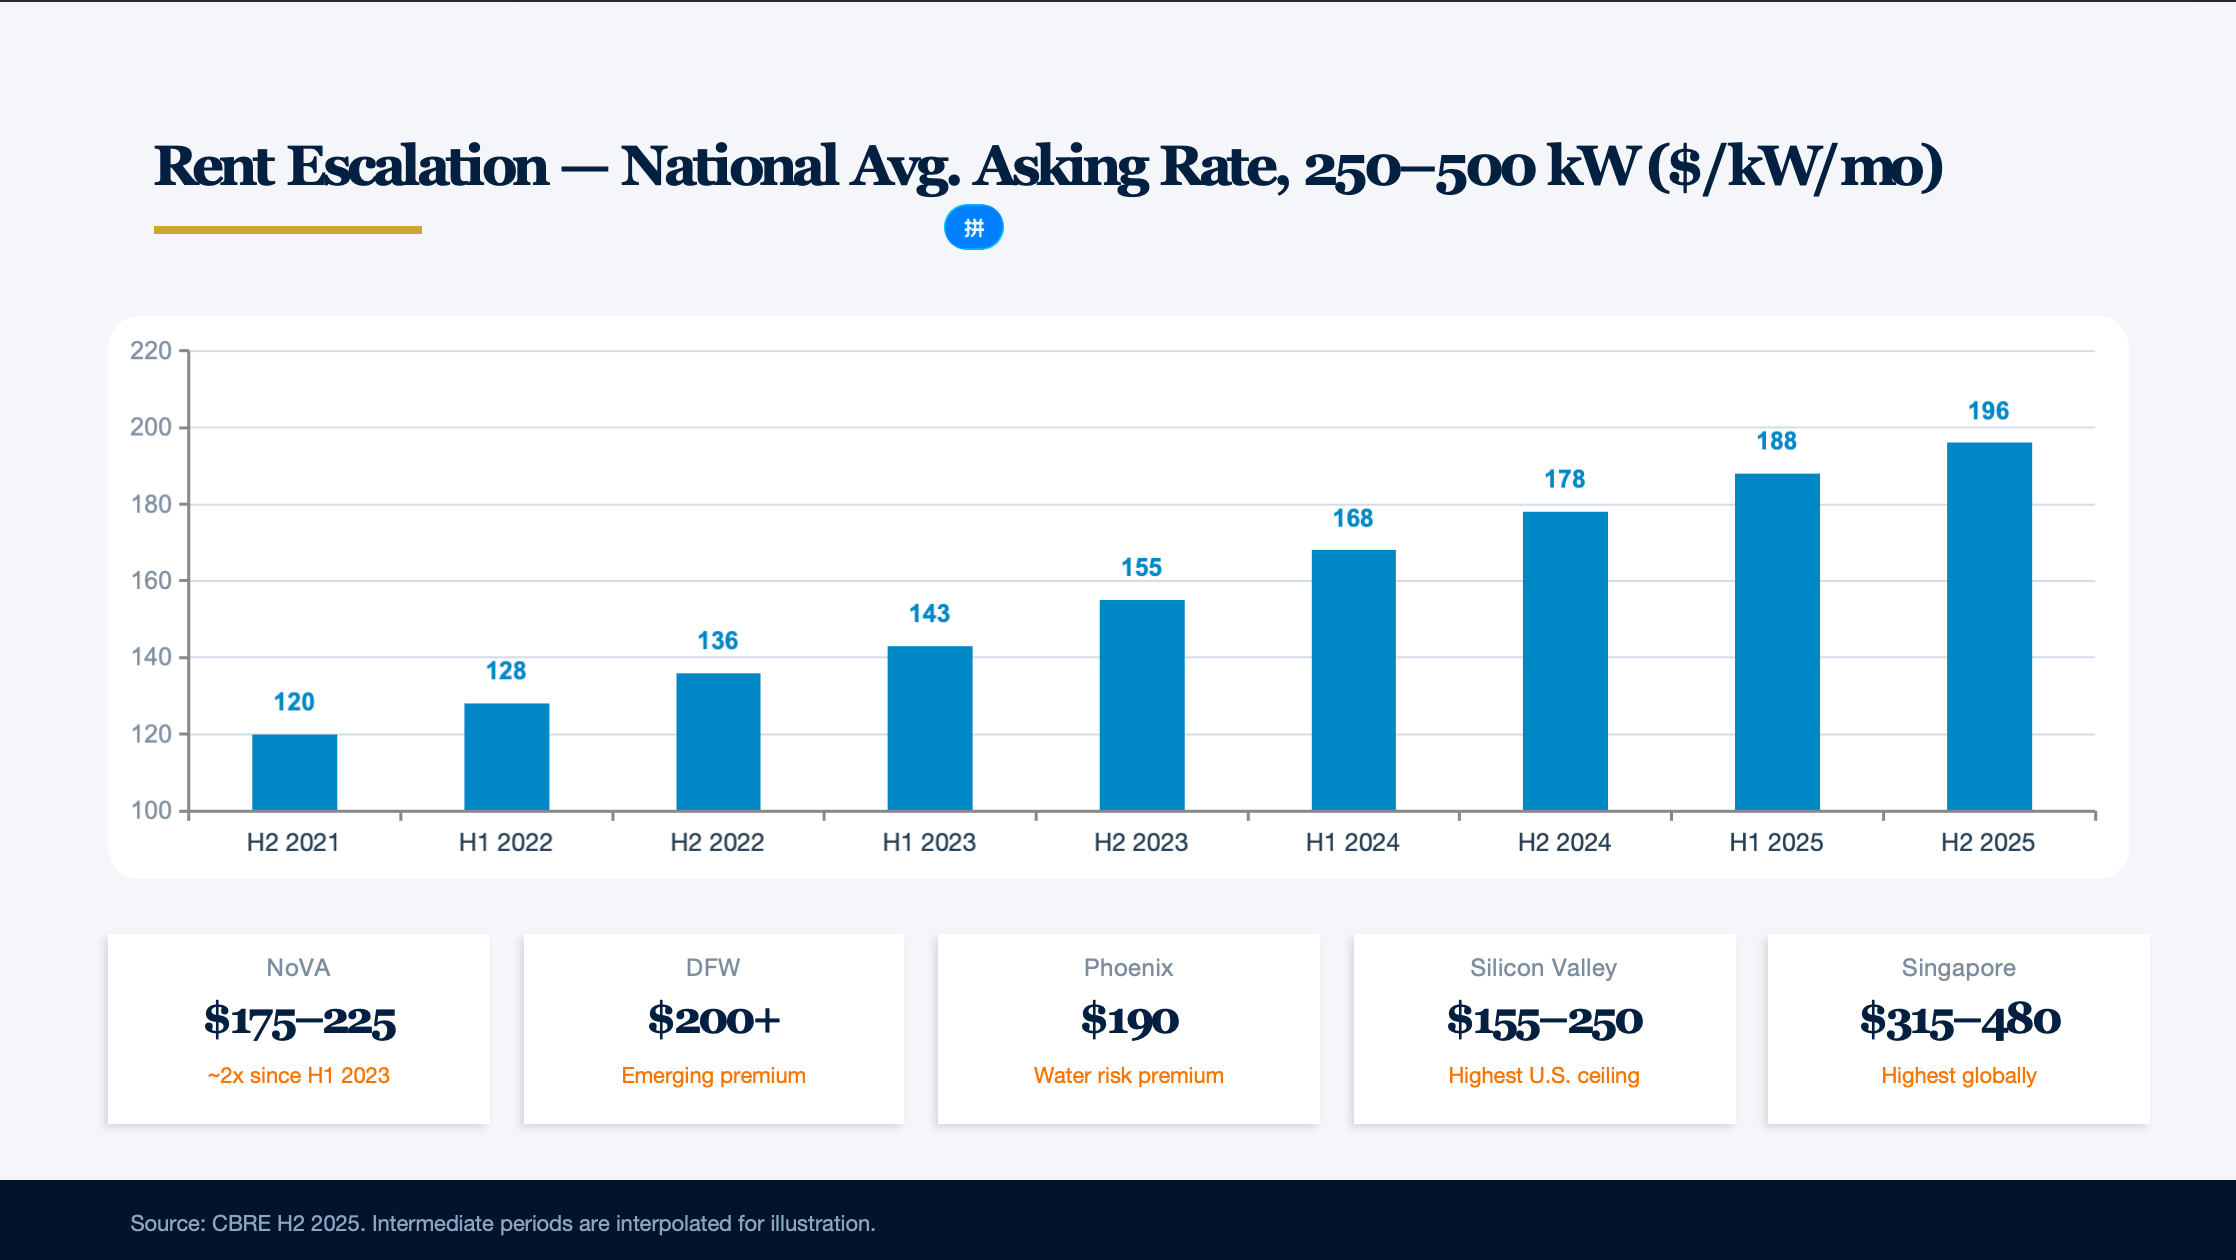
Rents continue to climb. The national average asking rate for 250–500 kW demand rose from approximately $120/kW/month in H2 2021 to $195.94/kW/month in H2 2025 (CBRE) — a 63%+ increase over four years and the fourth consecutive year of growth. Large-block 10–30 MW demand saw even steeper 19% increases. NoVA wholesale rents broke through $215/kW/month in Q2 2025 — a new all-time high. CBRE expects rents to remain above $200/kW/month in 2026.
| Market | Operating Capacity | Under Construction | Pipeline | Vacancy | Rent ($/kW/mo) | Power Rate (¢/kWh) |
|---|---|---|---|---|---|---|
| Northern Virginia | 5.6 GW | 2,078 MW | 5.9 GW | 0.5% | $175–225 | 8–10 |
| Dallas–Fort Worth | 1.5 GW | ~606 MW | 3.9 GW | <1% | $200+ | 6–8 |
| Phoenix | 2.4 GW | 1,300 MW | 4.2 GW | 3% | $190 | 7–9 |
| Chicago | 1.9 GW | 1,180 MW | 3+ GW | 1.9% | $155–165 | 6.9 |
| Silicon Valley | ~625 MW | 168 MW | Limited | 5.5% | $155–250 | 12.6–26 |
| Atlanta | 1,000 MW | 2,150 MW | Massive | 0.72% | Relatively stable | 9.94 |
| Montreal | 600+ MW pipeline | Multiple | Large | Tight | — | 2.8–4.2 |
Part II: Europe — Regulatory-Driven Green Transformation and Expansion
The FLAPD Five: Divergent Paths Among Core Markets
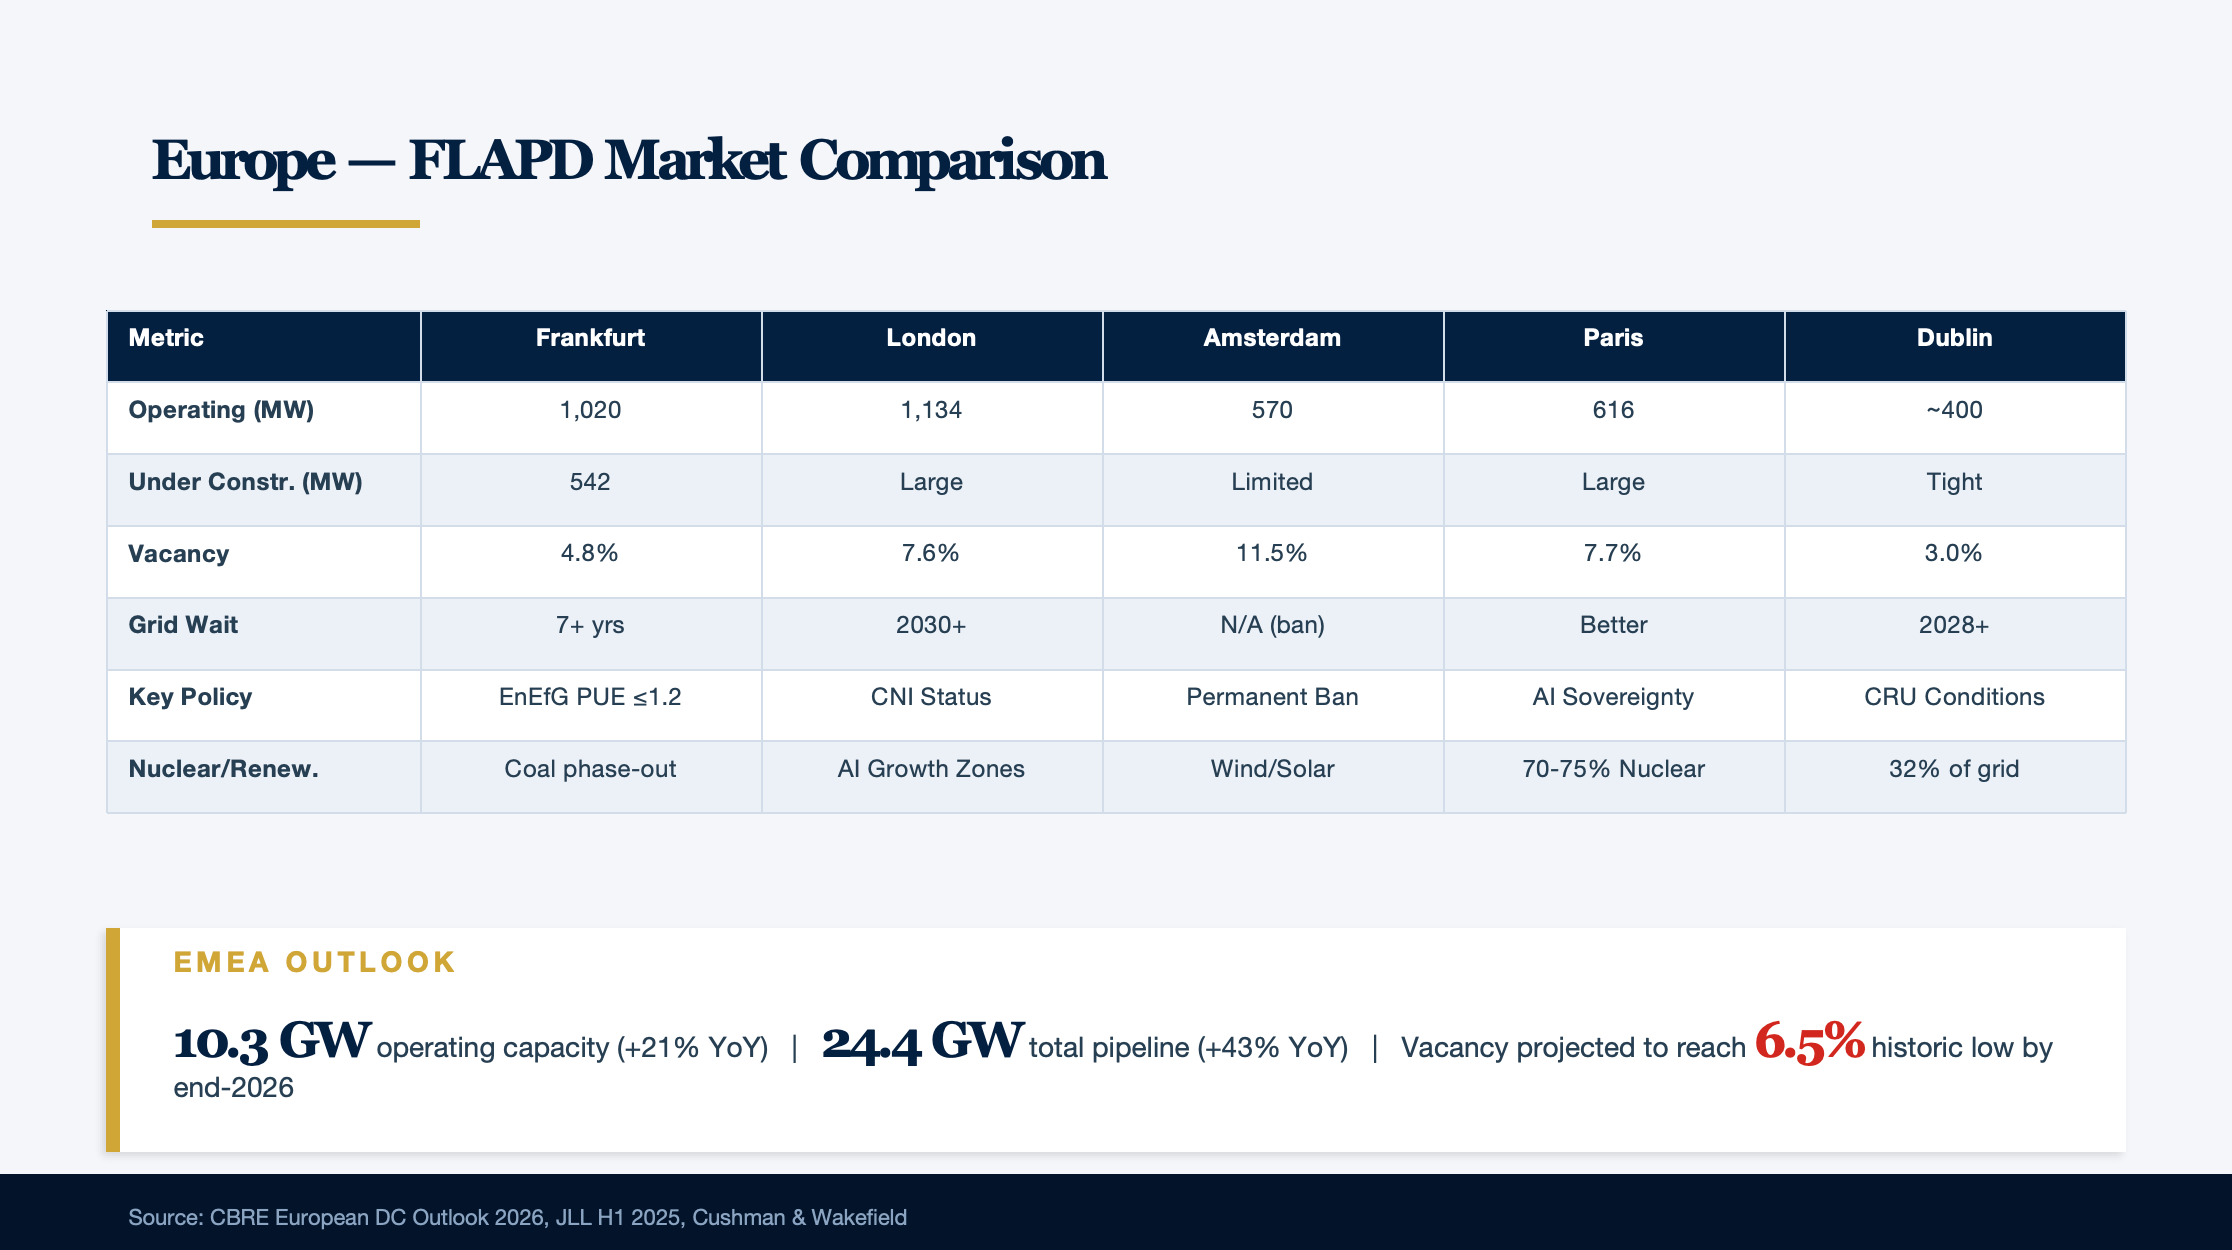
Frankfurt reached 1,020 MW of operating capacity (CBRE Q2 2025), becoming the second European city after London to breach 1 GW. Vacancy is 4.8%, projected to fall to 3.4% by year-end. Approximately 542 MW is under construction. Frankfurt faces unique regulatory pressure — Germany's Energy Efficiency Act (EnEfG), effective September 2023, imposes strict requirements: new data centers must achieve PUE ≤ 1.2 by July 2026; 100% renewable energy supply by January 2027; and waste heat utilization ≥ 20% by July 2028. Grid interconnection wait times exceed 7 years, with some developers shifting 30–40 km west to find power. However, the 2025 CDU/SPD coalition agreement signals potential relaxation of PUE and waste heat requirements. Hyperscaler investment in Germany is substantial: Microsoft €3.2 billion, AWS €8.8 billion (through 2026), Google €5.5 billion (through 2029).
London maintains its position as the largest EMEA market with 1,134 MW of operating capacity, but faces severe growth bottlenecks. West London's grid is fully allocated through 2029, with new projects waiting until 2030 or later. National Grid ESO has suspended new 132 kV connection offers in Greater London; self-built substations require an additional £150 million per 100 MW. Data centers already consume 18% of West London's electricity. Alternative zones are emerging rapidly — East London (Dagenham, Havering), Crawley, and northern regions. Vacancy has fallen to a historic low of 7.6% (JLL H1 2025), with large-block (5 MW+) vacancy at just 5.9%. The UK government announced a £14 billion AI data center program in January 2025, designating data centers as Critical National Infrastructure and establishing AI Growth Zones (minimum 500 MW each).
Amsterdam has the most restrictive policy environment among the FLAPD markets. Operating capacity stands at 570 MW, having been overtaken by Paris to drop to Europe's third-largest. Policy evolution: July 2019 sudden moratorium → 2022 lift with PUE ≤ 1.2 conditions → November 2022 national ban on hyperscale (>10 hectares and >70 MW) → April 2025 Amsterdam announces a permanent ban on new data center construction and expansion, with reassessment in 2030. This is not a "2035 ban" — there is no specific 2035-targeted legislation. The actual situation is an ongoing national hyperscale ban plus Amsterdam's comprehensive new-build prohibition. Netherlands data center count declined from 189 in 2019 to 187 in 2023, with colocation operators falling from 111 to 95. Vacancy at 11.5% is the highest among the FLAPD markets, but demand is being artificially suppressed by policy — international wholesale demand has largely redirected to other European markets.
Paris is achieving leapfrog growth through France's AI sovereignty strategy. Operating capacity reached 616 MW (CBRE Q2 2025), overtaking Amsterdam to become Europe's third-largest market in 2024. Vacancy plunged from 16.1% to 7.7% within a year — the steepest decline of any market. Early-stage pipeline exceeds 1.8 GW. France's AI action plan has announced €109 billion in investment, headlined by a 1.4 GW Paris AI Supercampus — a joint €8.5 billion venture between MGX (Abu Dhabi), Bpifrance, NVIDIA, and Mistral AI, breaking ground in H2 2026 with operations by 2028, billed as "Europe's largest AI campus." Brookfield has committed €20 billion to French AI infrastructure. France's core competitive advantage lies in nuclear power — approximately 70–75% of electricity comes from nuclear, providing stable, low-carbon, price-predictable baseload power.
Dublin has a vacancy rate of just 3% (JLL H1 2025), with large-block (5 MW+) vacancy even lower at 1.3% — pre-lease rates of 94.8% are the highest in EMEA. Data centers already consume 21% of Ireland's total electricity, projected to reach 32% by 2026. EirGrid has imposed a de facto grid connection moratorium on the Dublin region since 2021, expected to continue through 2028. In December 2025, the CRU issued a landmark final decision requiring large energy users (>10 MVA, Tier B) to: (1) provide dispatchable on-site/near-site generation matching 100% of maximum import capacity; (2) connect generation independently to the grid and participate in the SEM; (3) match 80% of annual consumption with additional renewable energy within Ireland (existing REFIT/RESS contracts ineligible); and (4) achieve renewable energy compliance within 6 years of energization. This effectively ends the 4-year moratorium, but on highly demanding terms.
Emerging European Markets: The "Second Tier" Takes Shape
The Nordics offer a unique combination of climate and renewable energy advantages — collectively sourcing 90%+ of electricity from renewables, with prices 40–50% below Western European core markets. Finland leads in growth (CAGR 9.10%), with a pipeline exceeding 5 GW. TikTok is investing €1 billion in Finland; XTX Markets is building a 250 MW supercompute campus in Kajaani for over €1 billion. In Sweden, Brookfield announced a $10 billion AI data center investment in Strängnäs (initial 300 MW, expandable to 750 MW) — the largest planned AI infrastructure cluster in Europe. Norway has attracted the OpenAI Stargate Norway project (Narvik, 230 MW renewable-powered AI campus), while CoreWeave has committed $2.2 billion to three Nordic data centers. Iceland, with 100% renewable energy (geothermal + hydro) and year-round free cooling, is emerging as ideal for energy-intensive AI workloads.
Southern Europe is experiencing an unprecedented investment boom. Portugal's Start Campus SINES is Europe's largest single colocation site — 1.2 GW total capacity, €8.5 billion total investment. The first facility SIN01 (26 MW) went live in April 2025; subsequent buildings (SIN02–06) scale up to 240 MW each, targeting rack densities of up to 700 kW/rack, PUE of 1.1, and zero WUE (seawater cooling). Microsoft has announced a $10 billion investment at Start Campus. Spain's market is valued at $6.89 billion (2025), with IT load CAGR of 23.92%. Italy/Milan has been elevated to "Powerhouse" market status by Cushman & Wakefield, with projected total capacity reaching 1.2 GW. Greece/Athens has planned capacity of 250+ MW — 6 times existing capacity — and has been upgraded to "Developing" market status.
Poland/Warsaw is Central and Eastern Europe's bridgehead — installed capacity of 660 MW (2025), projected to reach 1,000 MW by 2030. Hyperscale and enterprise AI commitments exceed $6 billion. Grid interconnection takes approximately 18 months, with an annual ICT talent gap of 50,000 professionals.
EMEA at a Glance: Vacancy to Hit Historic Lows
EMEA operating capacity stands at 10.3 GW (Cushman & Wakefield H1 2025, up 21% YoY), with 2.6 GW under construction, 11.5 GW in planning, and a 24.4 GW total pipeline (up 43% YoY). New capacity additions of approximately 850 MW in 2025 and a projected 710 MW in 2026 are expected to fall short of 848 MW in projected demand, driving vacancy still lower.
Vacancy is projected to fall to approximately 6.5% by end of 2026 — a historic low (CBRE European Data Centres Outlook 2026), down dramatically from 20.6% in 2019.
European construction costs exceed U.S. levels. Turner & Townsend's 2025 index shows Zurich at $14.2/W, Paris and Amsterdam at $10.8/W, Madrid and Dublin at $10.0/W, versus Atlanta at $9.9/W, Phoenix at $9.8/W, and Charlotte at $9.5/W. Drivers include: stricter sustainability regulation (EED compliance costs), limited contractor pools, higher labor costs (UK MEP wages up 12% YoY in 2025), transformer delivery times extending from 26 to 42 weeks, post-Brexit skills shortages, and more complex planning environments. 60% of industry respondents expect construction costs to increase by 5–15% in 2026.
Part III: Asia-Pacific — An AI Investment Tsunami Sweeps the Region
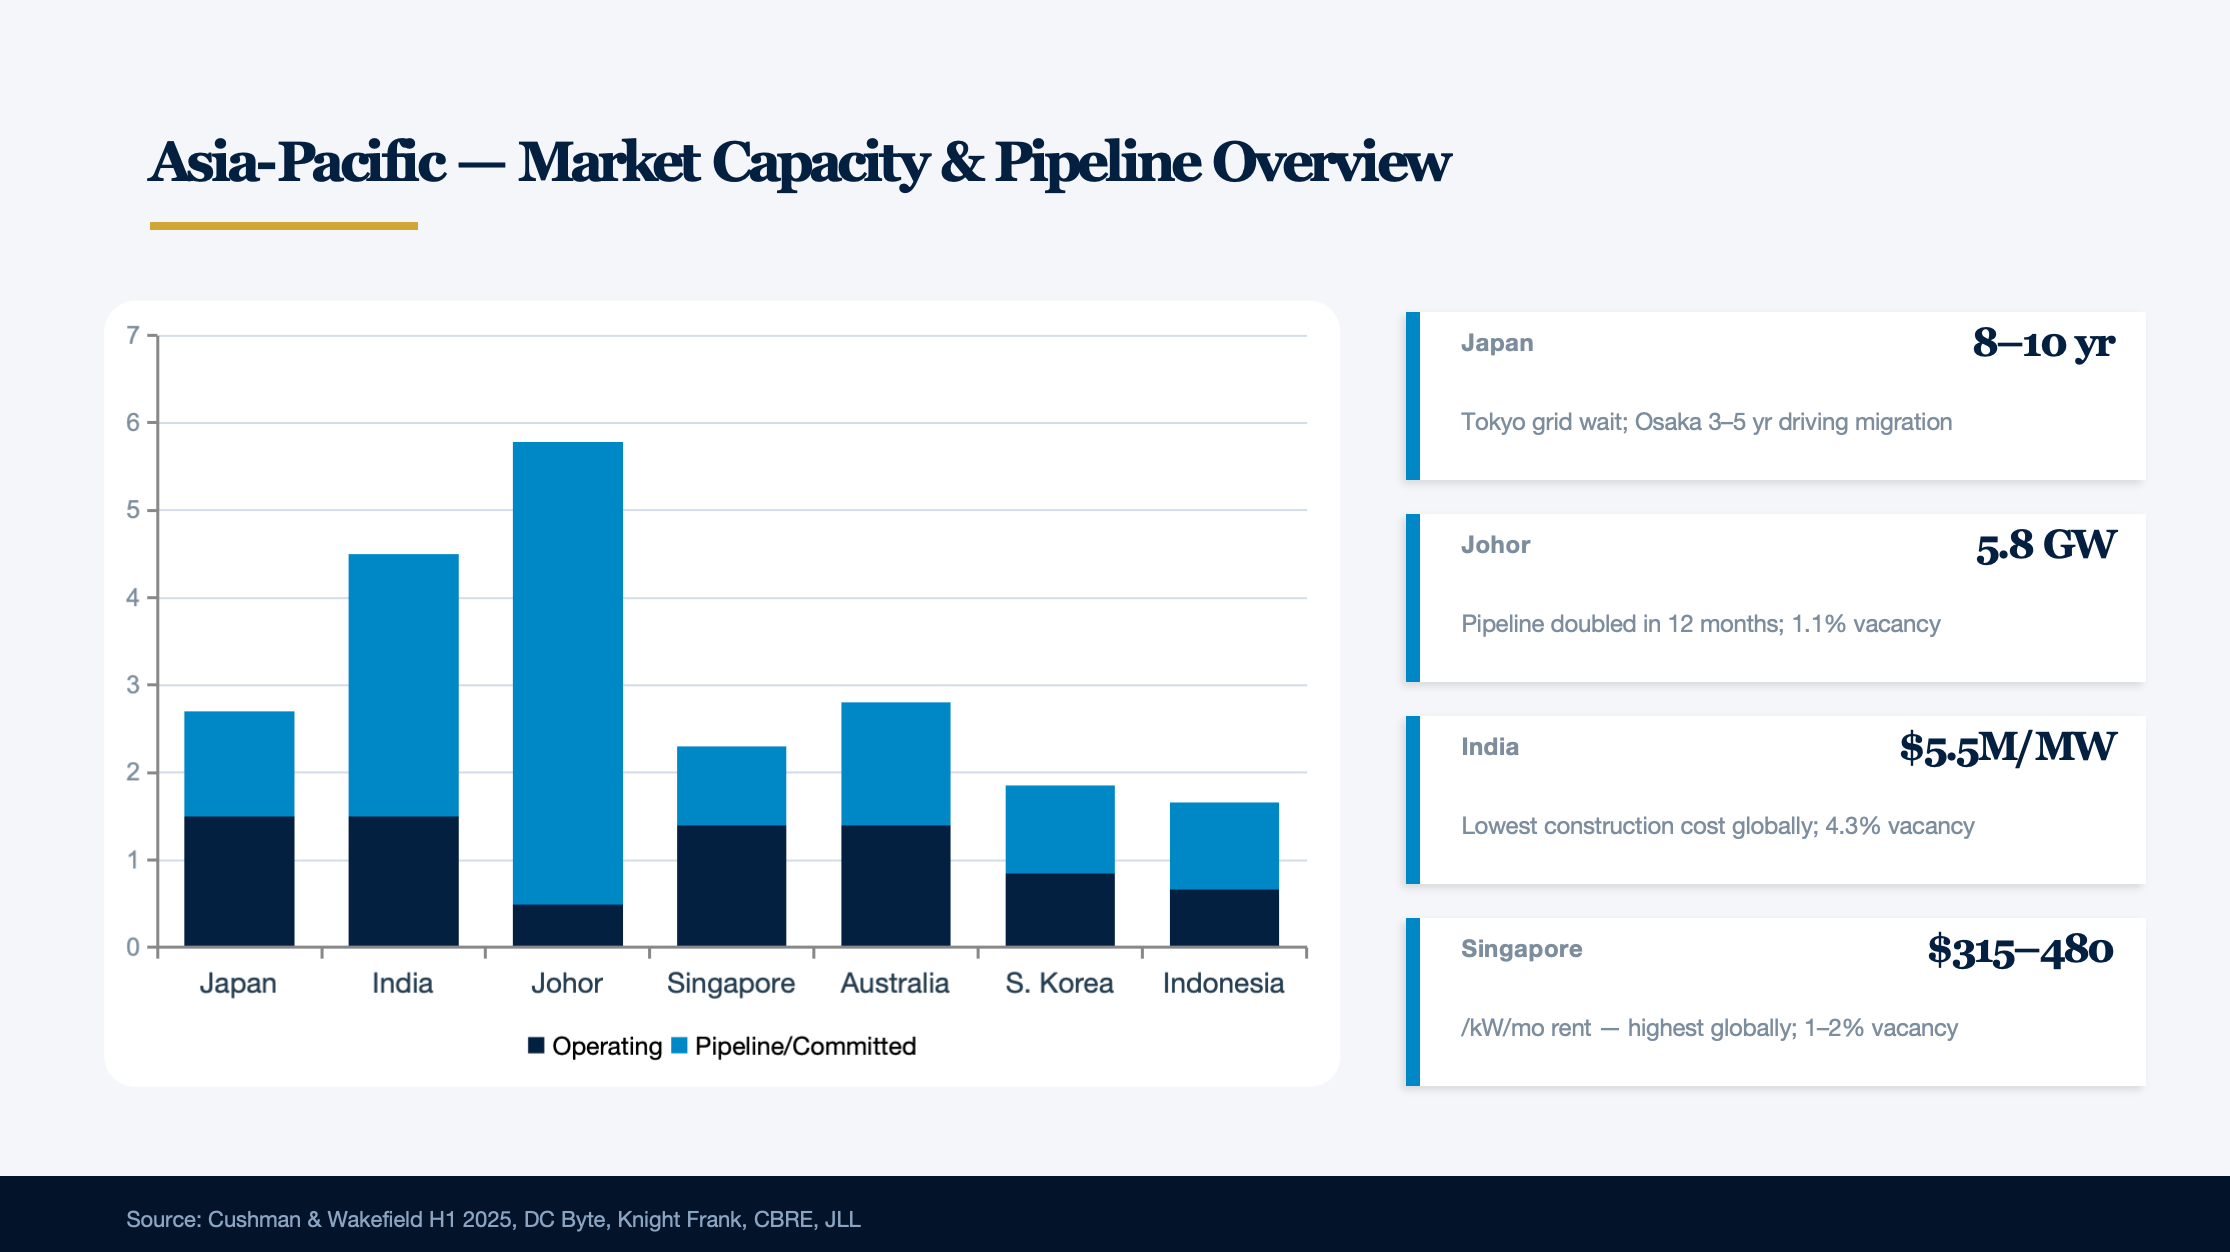
Asia-Pacific is experiencing the most dramatic data center expansion wave globally. Japan's construction pipeline exceeds 1.2 GW, Johor has 5.8 GW of committed capacity, and India's operational capacity has surpassed 1.5 GW — these three figures encapsulate a core reality: AI-driven compute demand is rewriting the Asia-Pacific data center map, creating a once-in-a-decade window for M&A investors.
Japan — Structural Opportunity Behind the Power Bottleneck
Three Markets Diverge; Osaka and Hokkaido Rise
Japan's data center market is valued at approximately $12.76 billion in 2025 (Arizton), with operational IT load capacity of approximately 1.5 GW (Cushman & Wakefield H1 2025), projected to reach $38.9 billion by 2031 (CAGR 20.42%). Tokyo still commands 40.7% market share, but Osaka is the fastest-growing region at 13.28% CAGR.
| Metric | Tokyo | Osaka | Hokkaido |
|---|---|---|---|
| Operating capacity (est.) | ~800–1,000 MW | ~300–400 MW | ~50 MW |
| Under construction / pipeline | 1.3 GW+ | 440 MW+ | 300 MW+ (SoftBank) |
| Wholesale rent ($/kW/mo) | $190–355 | Slightly below Tokyo | Lower (undisclosed) |
| Industrial power rate (¥/kWh) | ~¥18–20 | ~¥17–19 | Lower (renewable PPA) |
| Grid connection wait | 8–10 years (>10 MW) | 3–5 years | Relatively short |
| Natural disaster risk | High (earthquake + liquefaction) | Moderate (typhoon/storm surge) | Low-moderate (heavy snow) |
Tokyo's primary bottleneck is TEPCO power queues exceeding 36 months (154 kV connection waits can stretch to 7 years), while Osaka's 3–5-year timeline is driving significant developer migration to the Kansai region. OCCTO projects that electricity consumption from data centers and semiconductor factories will surge from 3.6 TWh in FY2025 to 51.4 TWh by FY2034 — roughly a 14-fold increase.
Emerging markets: Kyushu/Fukuoka is rising rapidly, with APL+GCI planning a 250 MW campus (first phase 120 MW, operational 2027). Hokkaido's SoftBank Tomakomai project spans 700,000 sqm with long-term potential of 1 GW, powered entirely by local renewables.
Japan Operator Landscape: NTT Leads; New Entrants Charge In
NTT is Japan's and one of the world's largest data center operators, with approximately 1,500 MW of global capacity, planning to double to 4 GW across 34 projects and targeting 5 GW+ within five years. Its most strategically significant move was the NTT DC REIT listing on the SGX on July 14, 2025, raising $773 million — Singapore's largest REIT IPO in over a decade, at 4.6x oversubscription and a projected annualized distribution yield of 7.5%.
SoftBank is the most aggressive AI data center player: the Sakai factory (initial 150 MW, expandable to 400 MW+, ¥100 billion investment, JV with OpenAI) and the Tomakomai project (initial 50 MW, long-term 1 GW). SoftBank also acquired DigitalBridge for $4 billion, gaining a global digital infrastructure management platform.
AirTrunk (Blackstone-owned) has invested over $8 billion in Japan across four campuses totaling approximately 530 MW. TOK1 secured a ¥191.6 billion ($1.24 billion) green loan — the largest data center financing in Japanese history. Princeton Digital Group is investing $1 billion in a 96 MW campus in Saitama, with rack density of 140 kW/rack.
Policy Tailwinds and FEFTA Scrutiny Coexist
The Japanese government offers multi-layered policy support. METI's Clean Energy Investment Subsidies provide up to 50% capex subsidies (from FY2026, over 5 years), with data centers explicitly included. The government has committed to investing at least ¥10 trillion ($66 billion) in AI by 2030.
Nuclear restart is a key variable. As of April 2026, Japan has 15 reactors operating, with total installed capacity of approximately 33 GW. TEPCO's Kashiwazaki-Kariwa Unit 6 restarted in February 2026 (1,356 MW) — TEPCO's first nuclear restart since Fukushima.
FEFTA foreign investment review requires prior notification and approval for acquisitions touching telecommunications and cybersecurity (triggered at 1% for listed companies). FY2024 filings hit a record 2,903. However, 2026 legislative amendments aim to narrow IT-sector review to critical cybersecurity operations only, potentially reducing the burden on pure real estate data center transactions.
M&A opportunity assessment: Yen depreciation (2024–2025 range: 145–160), relatively reasonable asset valuations, and increasing asset-sale willingness from domestic companies (NEC has already divested data centers; Fujitsu and Hitachi may follow) create a favorable entry window for foreign investors. Osaka Bay Area brownfield conversions of former factory sites (with existing power capacity) offer a low-cost entry path. Tokyo central-area data center development land commands premiums of up to 770% (for power-secured parcels).
Southeast Asia — The Johor Frenzy and Singapore Scarcity
Singapore: The Tightest Supply and Highest Rents Globally
Singapore's data center market is characterized by extreme undersupply: operating capacity of approximately 1.4 GW, vacancy of just 1–2% (CBRE Q1 2025), available capacity dipping as low as 4 MW, and wholesale rents of $315–$480/kW/month — the highest in the world. This scarcity stems from a de facto construction moratorium imposed in 2019.
DC-CFA2 was released in December 2025, opening at least 200 MW of new capacity. Selection criteria are significantly more stringent than the first round: PUE ≤ 1.25, renewable energy share ≥ 50% (from qualified green pathways; conventional RECs ineligible), and mandatory Green Mark for Data Centres 2024 Platinum certification.
The Jurong Island 700 MW Low-Carbon Data Center Park, announced in October 2025, is a joint EDB-JTC development. At 700 MW, it represents 50% of Singapore's existing capacity — a transformative expansion.
Of particular note, KKR and Singtel are acquiring the remaining 82% of STT GDC for approximately S$6.6 billion, at an implied enterprise value of approximately S$13.8 billion, expected to close in H2 2026 — one of the largest data center M&A transactions in Southeast Asia.
Johor: Asia-Pacific's Most Aggressive Data Center Expansion
Johor is experiencing the most concentrated investment surge in data center construction history. Per DC Byte (July 2025), Johor has 487 MW operational, 324 MW under construction, 1.4 GW committed, and 3.4 GW in early-stage planning. Knight Frank H1 2025 reports total pipeline supply of approximately 5.8 GW (doubling within 12 months), with vacancy of just 1.1%. The Johor state government has approved 51 projects totaling RM 182.96 billion in investment. Cushman & Wakefield projects Johor will become a 1 GW market by end of 2026.
Key projects:
| Operator | Capacity | Investment | Status |
|---|---|---|---|
| YTL Data Centers | 600 MW | RM 10 billion | Operational / Under construction |
| Bridge Data Centres MY07 | 400 MW | — | Under construction |
| AirTrunk JHB1+JHB2 | 420 MW+ | RM 9.7 billion | Operational / Under construction |
| Princeton Digital JH1+ | 350 MW+ | — | Operational / Under construction |
| Microsoft | Multi-phase | US$2.2 billion | Under construction / Planned |
| Currenc Group | 500 MW | — | Planned |
TNB (Tenaga Nasional) grid expansion is the critical bottleneck. TNB has signed 31 ESAs totaling 4,700 MW of demand and received new DC applications exceeding 11,000 MW (over 40% of Peninsular Malaysia's existing installed capacity). Actual DC utilization is only 47% of allocated capacity, raising waste concerns. Base electricity rates were raised to 45.62 sen/kWh from July 2025, but remain among the lowest in Asia-Pacific (~US$0.10/kWh vs. Singapore's US$0.27/kWh).
Core risk — water constraints: Johor has mandated that DC investors defer water-cooled expansion by at least 18 months (to mid-2027) and has stopped approving Tier 1/2 data centers. 2024 DC water allocation was just 6.10 MLD — only 21% of the amount requested. Projected 2030 DC water demand reaches 384 MLD.
The JS-SEZ (Johor-Singapore Special Economic Zone), signed in January 2025, offers qualifying enterprises a 5% corporate tax rate (up to 15 years). Singapore-Johor fiber latency is <5 ms. Singapore enterprises are broadly adopting a "dual hub" strategy: latency-sensitive workloads remain in Singapore, while GPU training and AI inference migrate to Johor.
Indonesia, Thailand, Vietnam, and the Philippines Each Occupy Distinct Positions
Indonesia: Jakarta's market stands at approximately 660 MW in 2025, with vacancy declining from 36% to 31%. DCI Indonesia (DCII) is the largest operator with 155 MW of 2025 capacity, revenue of IDR 2.54 trillion (+40.1%), and EBITDA margin of 61%. DCI-H3 Sky Bintan is planned for over 1,000 MW. Telkom is seeking strategic investors, potentially unlocking a ~US$1 billion opportunity — a notable M&A target.
Thailand: H1 2025 saw 28 approved projects totaling $16.1 billion investment (20x YoY growth). BOI offers 8-year corporate income tax exemption for high-efficiency DCs, with 100% foreign ownership permitted. Construction cost of only $7.1M/MW, though power at $108/MWh is mid-range.
Vietnam: Market is emerging with 41 DCs and 221 MW. 100% foreign ownership became effective January 2025. Construction cost is among Asia-Pacific's lowest at $6–8M/MW. Power supply reliability remains the core challenge.
Philippines: Manila at approximately 560 MW in 2025, with power costs of $154/MWh among the highest in Southeast Asia. SM Investments' August 2025 exit from the DC business, citing power costs and natural disaster risk, is a signal M&A buyers should note.
India — 3 GW Ambition and 60% Idle GPUs
Four Markets Drive 1.5 GW of Operational Capacity
India's 2025 data center operational IT load capacity reaches 1,123–1,530 MW (JLL/CBRE), with national vacancy at just 4.3% — extremely tight. Investment commitments from 2019–2025 exceed $94 billion cumulatively. Construction cost is among the world's lowest at approximately $5–5.5M/MW.
| Metric | Mumbai | Chennai | Hyderabad | Pune |
|---|---|---|---|---|
| Operating capacity | ~594 MW | ~550 MW | ~50 → rapid growth | ~90–100 MW |
| Market share | 41–54% | 20–23% | ~13% | ~5% |
| Power bottleneck | 36-month backlog | Grid delays | Relatively better | Better than Mumbai |
| Submarine cable connectivity | 2+ landing stations | 7+ cables / 420+ Tbps | None direct | None direct |
Chennai's core advantage is submarine cable connectivity — 7+ active cables with aggregate bandwidth of 420+ Tbps, positioning it as the top choice for latency-sensitive use cases such as gaming and financial trading.
Operator Landscape: GPU Concentration Is Striking
Yotta Infrastructure (Hiranandani Group) confirmed in a February 2026 CNBC interview that it holds 60–70% of India's GPU capacity. Currently operating approximately 10,000 H100 GPUs, with thousands of B200s deployed and 20,736 Blackwell Ultra B300 GPUs planned for August 2026 deployment. IPO target valuation: $4 billion.
AdaniConneX (Adani 50:50 EdgeConneX JV) is targeting 1 GW by 2030. Most notably, it signed a $15 billion AI data center partnership with Google (Visakhapatnam, GW-scale), including submarine cable and renewable energy infrastructure.
Reliance Jio has planned the world's largest single data center — Jamnagar 3 GW, with $20–30 billion investment, powered by a 5,000-acre green energy complex, targeting 24-month completion. Jio IPO is planned for H1 2026 at a target valuation of $120 billion.
Indian Policy: Interstate Competition Is Fierce; National Framework Pending
India classified data centers in the "Harmonized Master List" in 2022, granting infrastructure status and access to long-term, low-cost financing. The latest 2025 draft national policy proposes up to 20-year conditional tax exemptions, 100% electricity duty exemption, and data center SEZs. However, significant state-level policy variation persists, with no unified national policy.
100% FDI is open through the automatic route, but border-country entities (China, etc.) require government approval. In practice, approximately 30 separate approvals are needed. Key reference transactions: Equinix acquired GPX at 15x forward EBITDA ($161 million), and Blackstone + Panchshil committed $2.3 billion (500 MW).
Australia — The AirTrunk Benchmark and NEXTDC Deep Dive
Sydney Vacancy Falls to 5.2%; Western Sydney Becomes the New Engine
Australia's operating capacity stands at approximately 1.3–1.5 GW (2025), with a total pipeline of ~2.8 GW. Sydney H1 2025 vacancy plummeted from 9% to 5.2%, with average lease-up time compressing from 40 months (2020) to 13 months.
AirTrunk was acquired by Blackstone + CPP for A$24 billion (US$16.1 billion) — the largest data center transaction in history. Five Australian campuses total over 1.2 GW, with 800+ MW committed to customers. Reports from April 2026 indicate AirTrunk is planning a REIT-style IPO in Singapore to raise $1.5 billion.
NEXTDC (ASX:NXT) — Australia's Only Large-Scale Independent Pure-Play Data Center Stock
NEXTDC is the key reference for understanding Australian data center valuations.
| Metric | FY25 | 1H26 |
|---|---|---|
| Revenue | A$350.2M (+14%) | A$189.2M (+13%) |
| EBITDA | A$216.7M (+6%) | A$115.3M (+9%) |
| Contracted utilization | 244.8 MW (+42%) | 416.6 MW (+137%) |
| Billed utilization | 110.9 MW | 119.8 MW |
| Forward order book | — | 296.8 MW (FY26–29 conversion) |
Market cap of approximately A$8.9–9.3 billion; EV/EBITDA ~55x (TTM) — well above Equinix's 25–30x and Digital Realty's 20–25x, reflecting high growth expectations. Development pipeline totals over 3 GW, including S7 Eastern Creek (550+ MW, OpenAI MOU) and M4 Port Melbourne (150–162 MW, $2 billion AI Factory with liquid cooling). A full acquisition of NEXTDC would require approximately A$10–12 billion, which is feasible relative to AirTrunk's A$24 billion.
South Korea — Nuclear Advantage and Grid Bottlenecks
Seoul Vacancy Is Asia-Pacific's Second-Lowest; Power Limits Drive Decentralization
South Korea's data center operating capacity stands at approximately 850 MW (58 colocation facilities), with Seoul accounting for 52.1% and vacancy below 6% (Asia-Pacific's second-lowest after Singapore). Construction costs run approximately $10–11M/MW.
Seoul faces severe power supply constraints. KEPCO has announced restrictions on new power supply in the Seoul metropolitan area, extending power supply confirmation times to approximately 12 months. KEPCO debt exceeds KRW 202 trillion, severely constraining grid upgrade budgets.
SK + AWS Ulsan 1 GW Project: Asia-Pacific's Largest AI Data Center Partnership
Total investment of KRW 7 trillion (~$5.11 billion), with AWS contributing approximately $4 billion. First phase 41 MW (November 2027), second phase 103 MW (February 2029), long-term target 1 GW, deploying 60,000 GPUs — Korea's largest-scale deployment. Groundbreaking on August 29, 2025.
South Korea's nuclear fleet generates approximately 31% of total electricity, with 25 operating reactors totaling 30,054 MW. The government has reversed its predecessor's nuclear phase-out policy, planning 2 new reactors plus 1 SMR.
China — Accelerating Domestic Substitution and C-REIT Breakthrough
GDS and VNET Diverge; DayOne Could Reach $5 Billion Valuation
GDS Holdings FY2024 China revenue of RMB 10.322 billion (+5.5%), adjusted EBITDA margin of 47.2%. In Q1 2025, GDS secured 152 MW of AI-related orders — the largest single domestic booking ever. International operations, rebranded DayOne, raised over $2 billion in Series C funding (Coatue-led), with valuation potentially reaching $4–5 billion.
VNET Group FY2024 revenue of RMB 8.259 billion (+11.4%), with wholesale IDC revenue surging +125.4% in Q4. Turned to net profit (RMB 248 million) for the first time.
Chindata was taken private by Bain Capital for $3.16 billion (~9.4x EV/FY23E EBITDA). In March 2026, Bain is considering selling up to 70% of its stake (Citigroup/JPMorgan advising) — a significant M&A opportunity signal.
East-to-West Computing: 63% Rack Utilization Exposes Regional Imbalance
Across eight national hub nodes, total compute stands at 215.5 EFLOPS, with AI compute accounting for 80.8% and rack utilization of approximately 63% — meaning roughly half of installed cabinets remain idle. The core contradiction: eastern regions face undersupply while western regions lack sufficient local demand.
Domestic Chip Substitution Rate Surges from 15% to 30%
In China's 2024 AI accelerator market of 2.7+ million units: NVIDIA 66%, Huawei HiSilicon 23%, AMD 5%. Domestic brands shipped 820,000 units (penetration rate 30%, up from 15% in 2023). Jensen Huang acknowledged NVIDIA's China share fell from 95% four years ago to 50%. The April 2025 U.S. ban on H20 exports to China will further accelerate domestic substitution.
Huawei Ascend 910C (2025 mass production): FP16 peak 800 TFLOPS, HBM 128 GB. Inference performance reaches 60–80% of H100. Ascend holds 79% market share in municipal smart computing centers.
C-REIT Breakthrough: First Two Data Center REITs Approved
On June 18, 2025, the China Southern GDS Data Center REIT and China Southern Runze Technology REIT received CSRC registration approval — officially breaking the ice for China's public data center REITs. Globally, only 6 pure data center REITs exist (5 in the U.S. + 1 in Singapore); China's DC REITs are at a nascent stage, facing valuation challenges from rapid technology iteration and short hardware depreciation cycles (3–5 years).
The DeepSeek Effect: Jevons Paradox Drives Demand Up, Not Down
DeepSeek-V3 training cost was only $5.576 million (1/10th of Meta's open-source models); R1 inference costs are 95% lower than OpenAI o1. Yet the industry consensus holds: efficiency gains → cost reductions → broader enterprise adoption → net demand increase (Jevons Paradox). DeepSeek-V3.1 adopts UE8M0 FP8 Scale precision, specifically designed for domestic chips.
M&A Decision Framework: Key Takeaways
Market Attractiveness Rankings
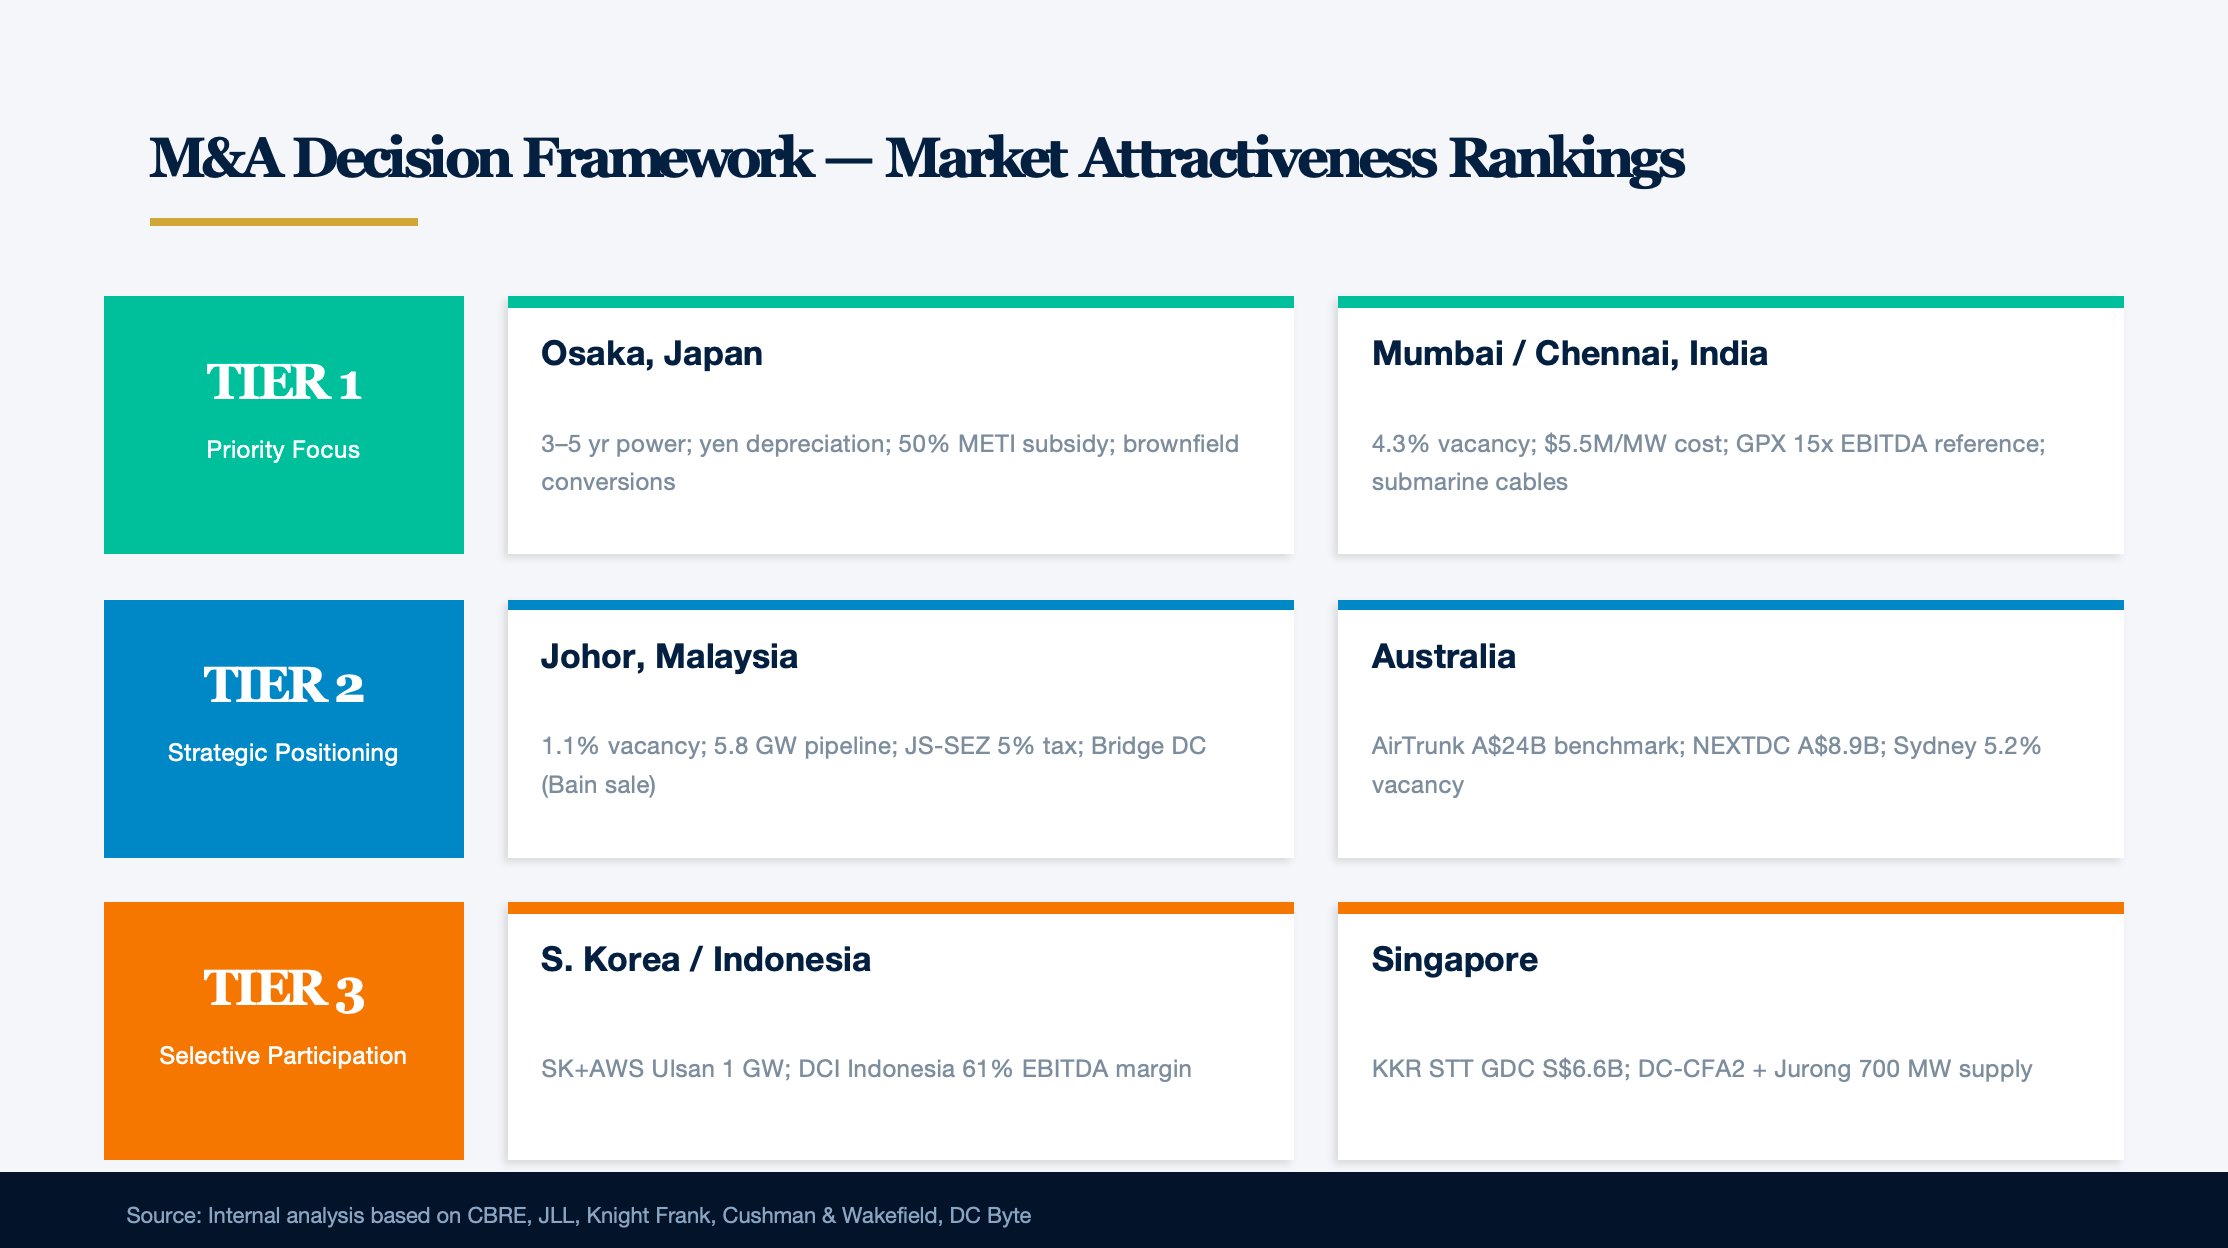
Based on a comprehensive assessment of market size, growth velocity, valuation reasonableness, policy environment, and risk-return profile:
Tier 1 (Priority Focus):
- Osaka, Japan: Power access timeline of 3–5 years (far superior to Tokyo's 8–10 years), brownfield factory conversions with existing power capacity, yen depreciation lowering acquisition costs, and METI offering 50% capex subsidies. Domestic companies (NEC et al.) showing increased willingness to divest assets. Watch FEFTA review timelines.
- Mumbai / Chennai, India: 4.3% vacancy and $5–5.5M/MW construction cost present compelling fundamentals. Yotta IPO ($4 billion), Sify IPO, and potential CtrlS IPO provide valuation anchors. The GPX transaction at 15x EBITDA serves as a reference multiple. Chennai's submarine cable infrastructure is uniquely differentiated.
Tier 2 (Strategic Positioning):
- Johor: 1.1% vacancy and a 5.8 GW pipeline indicate a market in the early stages of hypergrowth. Bridge Data Centres (Bain exploring sale of up to 70%) is an explicit M&A target. Water and grid constraints are core risks. JS-SEZ's 5% corporate tax provides structural advantage.
- Australia: AirTrunk's A$24 billion transaction (~A$30M/MW) establishes the valuation benchmark. NEXTDC (A$8.9 billion market cap, 3 GW pipeline) is the only large-scale independent target on the ASX. Sydney's 5.2% vacancy supports rental upside.
Tier 3 (Selective Participation):
- South Korea: Macquarie's Hwanam transaction ($580–720 million) provides valuation reference. Mid-cap operator consolidation opportunities exist, but KEPCO grid bottlenecks and Seoul restrictions are key barriers.
- Indonesia: DCI Indonesia (DCII, listed, 32% market share, 61% EBITDA margin) is one of Southeast Asia's most attractive listed pure-play targets. Telkom's strategic investor search could unlock a ~$1 billion opportunity.
- Singapore: Extremely scarce but nearly impossible to acquire new capacity. KKR's STT GDC 82% acquisition (S$6.6 billion) establishes valuation. DC-CFA2 and Jurong Island's 700 MW are the only new supply entry points.
Five Structural Themes
Power is the binding constraint on everything. From Tokyo's 8–10 years to Seoul's 12+ months to Navi Mumbai's 36 months, power interconnection timelines determine project viability. Existing assets with secured power command premiums of up to 770% (Tokyo). TNB Johor has signed 4,700 MW but received 11,000 MW of applications — the gap is stark.
The AI density revolution is transforming the construction paradigm. Rack densities are leaping from 8–10 kW toward 20–40 kW (and as high as 140 kW at Princeton Tokyo). Liquid cooling is shifting from optional to standard. This means existing air-cooled facilities face costly retrofits, capex intensity for new builds is rising sharply, but per-square-meter revenue is rising commensurately.
REIT-ification is accelerating capital recycling. NTT DC REIT's SGX listing ($773 million), AirTrunk's planned REIT IPO ($1.5 billion), China's first C-REITs, and DigiCo REIT's ASX listing — REITs are becoming the core instrument for data center operators to recycle capital and fund expansion.
Domestic chip substitution creates unique risk and opportunity in the China market. Huawei Ascend penetration has moved from 15% to 30%, with further acceleration inevitable following the H20 export ban. Domestic chips' "volume-for-quality" strategy is driving mega-cluster and higher-density power demand. However, technology iteration uncertainty and geopolitical risk demand cautious assessment of China market exposure.
Water is scarcer than power. Johor has mandated an 18-month deferral of water-cooled expansion, with 2024 water allocation at just 21% of requested volumes. Singapore has only 733 km² of land area. This will drive zero-water cooling technologies (air cooling, closed-loop liquid cooling) to become a source of competitive differentiation and M&A valuation premiums.
Data Center Business Models: A Three-Layer, Six-Category Framework
The data center industry has evolved from simple "rack-and-space rental" into a three-layer composite ecosystem spanning infrastructure, compute, and finance. In 2024–2025, the industry experienced an unprecedented capital influx — the top five hyperscalers' annual capex surged from ~$250 billion to ~$440 billion, while private market transaction multiples climbed to 25–30x EV/EBITDA, driven by exponential AI training and inference demand for power and compute. This report systematically presents the defining companies, latest financial data, and competitive dynamics across each sub-segment using a "three-layer, six-category" framework, providing a factual foundation for M&A decision-making.
Layer 1: Infrastructure — Buying "Powered Space"
Category A: Retail Interconnection Colocation — Network Effects as the Core Moat
Retail interconnection colocation charges by rack, cabinet, or kW, with typical deployment scales of ≤250 kW. The essence of this model lies in the value-added revenue system built around cross-connects. Equinix, the global benchmark, achieved FY2024 revenue of $8.748 billion (+7% YoY), adjusted EBITDA of $4.097 billion at a 47% margin — up 160 bps YoY; FY2025 guidance projects further improvement to 49%.
Unit economics and pricing. Average asking rates for North American Tier 1 retail colocation reached $195.94/kW/month in H2 2025, up 6.5% YoY. Equinix's global average cross-connect fee is $254/month ($341 Americas, $158 EMEA, $232 APAC), annualizing to approximately $3,048/connection. Interconnection revenue accounts for 19% of Equinix's recurring revenue, growing 9% in FY2024 and crossing $400 million in a single quarter for the first time in Q2 2025. On a per-MW basis, retail colocation generates annual revenue of approximately $3–5 million, significantly exceeding wholesale's $1–2 million.
Contract structure and customer stickiness. Equinix enterprise customers have an average contract term of 3.8 years, with annual escalators typically at 2.5–5% (CPI-linked or fixed). Quarterly MRR churn holds within the 2.0–2.5% range. Digital Realty posted renewal rent increases of 4.7% (cash) / 9.1% (GAAP) in Q4 2024 and 15.2% / 27.5% in Q3 2024, reflecting acute market undersupply.
Competitive moat analysis. Equinix operates 270+ data centers across 77 markets, serving 10,000+ customers and 2,000+ network providers, with over 492,000 interconnections as of Q2 2025 — more than double its nearest competitor. This interconnection density has accumulated over 25+ years and is virtually impossible for new entrants to replicate. Recurring revenue accounts for 93.55% of total. However, Hindenburg Research's March 2024 short report noted that hyperscaler customers are developing Equinix-bypass services, with interconnection revenue growth decelerating from 16.7% (2018) to 3.4% (2023).
The core of the interconnection model lies in bilateral network effects: more networks and cloud providers → more valuable for enterprise customers → attracts more enterprises → in turn attracts more networks. Equinix took 25+ years to build its 492,000+ interconnections.
AI-era impact and opportunity. Traditional enterprise customers continue migrating to cloud, but AI inference demand for low-latency edge deployments is creating new retail colocation growth vectors. Equinix hosts approximately 40% of global Cloud On-Ramp nodes, with the six largest cloud providers deploying 190+ cloud edge nodes — 3x the runner-up. High-density AI racks (40–80+ kW) are driving retrofit demand: high-power cabinets (6.6 kW+) have occupancy rates exceeding 80%, while low-power (<4.4 kW) occupancy is below 60%.
Representative Companies
Equinix (EQIX): FY2024 revenue $8.748 billion (+7%); adjusted EBITDA $4.097 billion, 47% margin; AFFO/share $35.02 (+9%). Interconnection revenue at 19% of recurring revenue grew 9% YoY. 260+ IBX data centers across 70+ cities and 30+ countries, serving 10,000+ customers. Two-thirds of recurring revenue comes from customers deployed in 10+ IBXs. FY2025 guidance: revenue $9.03–9.13 billion, EBITDA margin expanding to 49%. EV/EBITDA ~27x; enterprise value exceeds $110 billion. SEC closed its investigation in November 2025 following Hindenburg's short report, taking no enforcement action.
CoreSite (American Tower subsidiary): Acquired by American Tower for $10.4 billion in 2021. FY2024 data center revenue $925 million (+11%), 30 data centers across 12 U.S. core markets, 39,250+ cross-connects, average recurring revenue per cabinet of $1,799/month (+8.5%), occupancy 85.5%.
Cyxtera — A cautionary tale. This 60-facility, 2,300-customer retail colocation operator filed Chapter 11 in June 2023. Pre-bankruptcy FY2022 revenue was $746 million, with EBITDA margin of just 32% (vs. Equinix's 47%), occupancy of 74.9%, and cumulative losses of $1.577 billion. The lethal combination: high-leverage SPAC listing + floating-rate debt (interest expense doubling to $75.7 million/quarter) + ~$1 billion in loans maturing in 2024. Brookfield acquired its assets in January 2024 for just $775 million — versus CoreSite's $10.4 billion acquisition price. The core differentiator: interconnection revenue share (Cyxtera 11% vs. Equinix 19%) and customer stickiness.
| Company | FY2024 Revenue | EBITDA Margin | Interconnections | Data Centers | EV/EBITDA |
|---|---|---|---|---|---|
| Equinix | $8.75B | 47% | 482,000+ | 260+ | ~27x |
| CoreSite / AMT | $925M | ~49% (OP) | 39,250+ | 30 | N/A (subsidiary) |
| Global Switch | ~$550M | ~49% | N/A | 12 | 25x (AUS sale) |
| GDS Holdings | ~$1.43B | ~48% | N/A | Multiple | ~16–18x |
| VNET Group | ~$1.13B | ~29% | N/A | 52,107 cabinets | N/A |
| Cyxtera (pre-BK) | $746M | ~32% | N/A | ~60 | Bankrupt |
Category B: Wholesale / Build-to-Suit Colocation — The GW-Scale Race Driven by Hyperscale Customers
Wholesale colocation leases by floor, building, or campus — priced per MW to large customers. Delivery tiers range from Shell & Core to Powered Shell to Turn-key. CBRE data shows North American Tier 1 wholesale asking rates reached $184.06/kW/month in H2 2024 (+12.6% YoY); NoVA broke $215/kW/month in Q2 2025, setting a new all-time high. This segment has entered the GW-scale competition era — QTS has expanded from 330 MW at acquisition to 3 GW+, Digital Realty's developable capacity reaches 5 GW, and STACK's pipeline exceeds 6.5 GW.
Construction costs and returns. Standard wholesale data center construction costs approximately $10–12M/MW (Cushman & Wakefield 2025, U.S. 19-market average $11.7M/MW), ranging globally from $9.3M (San Antonio) to $15M (Reno). AI-ready facilities (with liquid cooling) reach $20M+/MW; full-stack AI data centers (including GPUs) can hit $30–35M+/MW. Stabilized cap rates range 4.25–6.25%, with 5-year unlevered IRR of 7.0–8.5%.
Tier 1 market vacancy fell to a historic low of 1.9% by end of 2024, declining further to 1.4% by end of 2025. Under-construction capacity exceeds 6,350 MW — more than double the 3,078 MW at end of 2023.
AI-era contract transformation. Three significant changes: First, single-deal sizes have surged from 10–50 MW to 100–500 MW+. Second, contract terms are extending to 10–20 years. Third, pre-lease rates have climbed sharply — hyperscale customers pre-lease 70–90% of capacity before construction begins, some locking in 3–4 years ahead.
Landmark M&A transactions. Blackstone acquired QTS in 2021 for $10 billion (~25x EV/EBITDA); as of September 2024, Blackstone had realized over 2.5x return. KKR and GIP took CyrusOne private in 2022 for $15 billion (26.4x TEV/EBITDA). DigitalBridge and IFM acquired Switch for $11 billion. These deals established the 25–30x EBITDA valuation anchor for premium wholesale platforms.
Representative Companies
Digital Realty (DLR): FY2024 revenue $5.555 billion (+1.4%). Operating 310+ data centers across 50+ cities and 25+ countries. Operating capacity ~2,500 MW, under construction 769 MW, developable 3+ GW, total potential ~5 GW. Signed-but-not-commenced lease backlog of $1.4 billion in annualized rent. EV/EBITDA ~20–23x.
QTS (Blackstone-owned): The textbook PE value creation case. Acquired in 2021 at $10 billion with 28 data centers and 330 MW. By 2025: 70+ facilities, 3 GW+ capacity, leased capacity up 12–14x, development pipeline up 25x+. Market rents up 84% since acquisition. Blackstone's overall data center portfolio has reached $700 billion (including under construction), with a $100 billion+ pipeline.
STACK Infrastructure: From 8 data centers (100 MW) in 2019 to 4.0+ GW built/under construction, with 2.5+ GW planned — total pipeline 6.5+ GW. Cumulative financing exceeds $21 billion. Flagship Stafford campus (Virginia) plans 1+ GW, with Oracle committing 4.5 GW to the platform.
Asia-Pacific wholesale: AirTrunk acquired by Blackstone for A$24 billion (~US$16.1 billion) — APAC's largest data center platform, with 800+ MW committed and land supporting 1+ GW of additional growth. Bridge Data Centres (Bain Capital-owned) operates 9 data centers; Bain is exploring sale of up to 70% of its stake.
Category C: Power-First Development — Power Access Rights as the Core Asset
Companies in this category are fundamentally executing "power arbitrage" — acquiring land, securing power, building shells, and leasing out. The core asset is not the building but the power access rights and reserves. Aligned's $40 billion acquisition price implied ~$8 billion per GW of power reserves across its 5 GW+ portfolio.
The data center industry has undergone a decisive paradigm shift: data centers are no longer a real estate story — they have become a test of power allocation, infrastructure governance, and political will. The U.S. DOE estimates that 100 GW of new peak generation capacity will be needed by 2030, with half driven by data centers.
Power arbitrage economics. Developers lock in long-term nuclear PPAs (~$40–60/MWh fixed) and lease to customers at $184+/kW/month wholesale rates. Equinix CFO Keith Taylor disclosed in Q3 2025 that stabilized data centers deliver a 26% cash-on-cash return on total PP&E, versus ~4% debt costs — a spread he characterized as "astronomical."
Powered vs. unpowered land — the valuation chasm. Texas power-ready sites trade at approximately $20/sq ft (~$800K/acre), while sites without power infrastructure fetch just $2,500–$10,000/acre — a 80–320x power premium. In NoVA, a 124-acre parcel sold to Microsoft for $465.5 million (~$3.75 million/acre). Digital Realty controls 5 GW of powered land reserves; Equinix holds 3 GW.
Behind-the-meter (BTM) generation at scale. Goldman Sachs projects BTM systems will supply 25–33% of incremental data center power demand by 2030. Landmark projects include: Meta Ohio 200 MW gas turbines; Meta Louisiana Hyperion 2.26 GW with three H-class gas turbines + 1.5 GW solar (5 GW target); Oracle/OpenAI Stargate Abilene 1.2 GW BTM gas generation.
Nuclear PPAs as strategic focus. Constellation Energy / Microsoft: 20-year PPA to restart Three Mile Island (835 MW, $1.6 billion investment, target 2027). Amazon / Talen Energy: 1,920 MW Susquehanna nuclear PPA (through 2042, $20 billion PA investment). Google / Kairos Power: first corporate SMR fleet deal — 500 MW pipeline by 2035, first unit online 2030.
Representative Companies
Aligned Data Centers: Acquired in October 2025 by the AI Infrastructure Partnership (BlackRock/GIP/MGX/Microsoft/NVIDIA) for approximately $40 billion — the largest data center transaction in history. Total capacity exceeds 5 GW across 50 campuses in the Americas. Seller Macquarie first invested in 2018 when Aligned had just 2 facilities and 85 MW; the exit at $40 billion implies a 20x+ estimated return over 7 years.
Vantage Data Centers: Global capacity exceeds 2.6 GW across 25+ campuses on 5 continents. Completed $9.2 billion in equity investment in 2024 (DigitalBridge and Silver Lake co-lead). Frontier campus (Texas): $25+ billion investment, 1.4 GW, 10 data centers, 3.7M sq ft, first building expected H2 2026.
EdgeConneX (EQT-owned): Acquired by EQT in 2020 for approximately $2.7 billion (24x EBITDA). Capacity has since tripled, expanding to 80 data centers across 50+ markets. Current estimated enterprise value: $10 billion+.
Layer 2: Compute — Buying "Compute Capacity"
Category D: GPU Cloud — Data Center Shell + GPU Assets + Cloud Platform
GPU-as-a-Service deploys proprietary GPUs in leased data center shells, charging by compute-hour. CoreWeave, with FY2025 revenue of $5.1 billion (+168%), an RPO of $60.7 billion, and 3.1 GW of contracted power, has joined the ranks of major tech infrastructure companies in its IPO year — while simultaneously carrying over $21 billion in debt and extreme customer concentration risk (Microsoft at 67% of revenue).
CoreWeave (CRWV): IPO'd on NASDAQ in March 2025 at $40/share, raising approximately $1.4 billion. FY2024 revenue $1.92 billion (+737%); FY2025 revenue $5.1 billion (+168%). RPO surged from $15.1 billion (end 2024) to $60.7 billion (end 2025). GPU fleet exceeds 250,000 units; active power 850+ MW; contracted power approximately 3.1 GW. Net loss widened from $863 million (2024) to $1.2 billion (2025). DDTL 4.0 (March 2026, $8.5 billion) received a Moody's A3 investment-grade rating — the first-ever investment-grade GPU-backed loan, anchored by Meta's $14.2 billion contract. Customer concentration: Microsoft at 67% of 2025 revenue, OpenAI $22.4 billion contract, Meta $14.2 billion, NVIDIA $6.3 billion.
Representative Companies
Lambda Labs: Completed $1.5 billion+ Series E in November 2025. Estimated 2024 revenue ~$425 million (+70%), gross margin ~50%. Core differentiation is developer-friendly experience and pricing advantage (H100 at $1.89–2.49/GPU·hour vs. CoreWeave's ~$4.25).
Crusoe Energy: Unique vertical integration from energy procurement through data center design/construction to AI cloud platform; energy costs 30–50% below traditional hyperscalers. Fully pivoted from bitcoin mining to AI cloud after selling mining operations to NYDIG in 2024.
Neocloud vs. hyperscale GPU pricing — the gap is narrowing. In June 2025, AWS cut H100 on-demand pricing by 44% to ~$3.90/GPU·hour — a pivotal inflection point. Pre-cut neocloud advantage was 30–70%; post-cut it has narrowed to approximately 30–50%.
| Company | 2024 Revenue | 2025 Revenue | Valuation / Market Cap | Core Model |
|---|---|---|---|---|
| CoreWeave | $1.92B | $5.1B | Market cap ~$40–70B | GPU cloud (leased shell + owned GPU + platform) |
| Lambda Labs | ~$425M | ~$520M | $2.5–4B (private) | Developer-friendly GPU cloud |
| Crusoe Energy | ~$276M | ~$500M–1B | $10B+ (private) | Energy + DC + GPU vertical integration |
| Applied Digital | ~$165M (FY25) | ~$350M (FY26E) | Market cap ~$3B | DC development → HPC leasing |
| Together AI | ~$50–130M | ~$120–300M | $3.3B (private) | GPU cloud + open-source models |
Category E: Hyperscaler Self-Build — The Capital Expenditure Tsunami from the Industry's Largest Customer Cohort
Synergy Research Group data shows that as of early 2025, hyperscalers operate 1,189 large data centers globally, controlling 41% of global data center capacity. Roughly half are self-built; the remainder are provided by third-party operators. However, this split varies dramatically by region: AWS in Australia sources approximately 60% of capacity from leasing; Microsoft in Australia was 100% leased until recently.
Self-build TCO advantage. Hyperscaler self-built facilities achieve PUE of 1.05–1.25, significantly outperforming the industry average of 1.5–1.6. However, CreditSights (2026) notes that hyperscalers are increasingly turning to leasing for its "lower cash capex and long-term flexibility."
The case for continued leasing. L.E.K. Consulting (2025) projects that hyperscalers will continue sourcing the majority of capacity from third-party operators over the next 10–15 years. Five key drivers: (1) Speed — leasing is 12–24 months faster than self-build; (2) International market entry where scale doesn't justify self-build; (3) Capital efficiency — converting capex to opex, preserving balance sheet for GPUs, chips, and software; (4) Local resource access — incumbents have decades-long utility, government, and supply chain relationships; (5) Operational bandwidth — self-building everywhere dilutes engineering and operations teams.
2024–2026 hyperscaler capex explosion. Combined capex of four hyperscalers (AWS, Google, Microsoft, Meta) surged from $155 billion (2023) to $251 billion (2024, +62%), with 2025 guidance at $315–350 billion and 2026 projected at $500–600 billion. Approximately 75% of 2026 capex will target AI infrastructure.
Representative Companies
AWS / Amazon: 2024 capex $83.9 billion, with AWS-specific capex ~$53.3 billion. 2025 guidance raised to $125 billion. 39 regions, 120 availability zones, 353 data centers globally. Trainium3 (December 2025) is the first 3nm AI chip at 2.52 PFLOPS FP8 per die.
Microsoft / Azure: FY2025 capex approximately $80 billion. The largest CoreWeave customer with a $10 billion six-year contract. Maia 200 (January 2026): 3nm inference-optimized AI accelerator with 216 GB HBM3e.
Google / Alphabet: 2024 capex $52.5 billion; 2025 guidance raised three times to $91–93 billion. TPU v7 Ironwood (April 2025): 4,614 TFLOPS FP8 per chip; 9,216-chip Superpod delivers 42.5 Exaflops at ~44% lower TCO than NVIDIA GB200.
Meta: 2024 capex ~$39.2 billion; 2025 guidance $70–72 billion (+81%); 2026 guidance $115–135 billion (nearly doubling). Hyperion campus (Louisiana) spans the equivalent of Manhattan, expandable to 5 GW. MTIA chip roadmap is exceptionally aggressive — one generation every 6 months (far faster than the industry's 12–24 months).
Oracle: FY2025 capex $21.2 billion (FY2024: $6.9 billion, +207%); FY2026 guidance raised to $50 billion. In Q3 2025, Oracle leased 5.4 GW in a single quarter in the U.S. (73% of the total 7.4 GW) — exceeding all of 2024. RPO of $523 billion. Oracle's model is distinctive: GPUs/servers are purchased, but land/buildings/power are primarily leased — making it the single largest source of incremental demand for the wholesale colocation industry.
Layer 3: Financial — Buying "Cash Flow Structure"
Category F: REIT Platforms — Widening Valuation Divergence in Public Markets
Data center REITs offer liquidity, tax advantages, and stable distributions, but valuations have become highly differentiated — U.S. large-cap REITs trade at 27x EV/EBITDA, while newly listed Asia-Pacific REITs attract yield-seeking investors with 7–8% distribution yields, and China C-REITs reflect risk premiums at 16.9x.
Representative Companies
Equinix REIT: Enterprise value exceeds $110 billion; EV/EBITDA ~27x — the highest among global data center REITs, reflecting its interconnection network effects and global footprint. Dividend yield ~2.1% (10th consecutive year of 10% growth).
Digital Realty REIT: EV/EBITDA ~20–23x; dividend yield ~2.7–3.5%. The $7 billion Blackstone JV is its key lever for the hyperscale market, covering 500 MW / 10 data centers across Frankfurt, Paris, and NoVA.
Iron Mountain (IRM): Data center revenue of approximately $800 million in 2025 (+~30% YoY), Q3 single-quarter growth of 33%. Data centers now account for ~12% of total revenue. 2024 stock price gained approximately 79.7% (vs. S&P 500's 21.2%).
NTT DC REIT: Listed on SGX July 14, 2025 — Singapore's largest REIT IPO in a decade. Raised US$773 million; initial portfolio of 6 data centers (4 U.S., 1 Austria, 1 Singapore), 90.7 MW design IT load. Projected distribution yield 7.5–7.8%.
GDS C-REIT (508060, SSE): Listed August 8, 2025 at RMB 3.00/unit, raising RMB 2.4 billion. Institutional subscription 166x oversubscribed; retail 456x. Implied EV/EBITDA 16.9x; projected distribution yield 5.2%.
DigiCo REIT (DGT, ASX) — A cautionary case. IPO'd December 13, 2024 at A$5.00/unit (A$2.75 billion market cap). Subsequently crashed to ~A$1.74 by March 2026 — 65% below IPO price. Current distribution yield ~9.4%, but fundamentals are under pressure.
| REIT | Exchange | Enterprise Value | EV/EBITDA | Yield | NAV Premium/Discount |
|---|---|---|---|---|---|
| Equinix | NASDAQ | ~$111.6B | ~27x | ~2.1% | Significant premium |
| Digital Realty | NYSE | ~$61B | ~20–23x | ~2.7–3.5% | Premium |
| Iron Mountain | NYSE | ~$40B | ~23–25x | ~2.5–3% | Significant premium |
| Keppel DC REIT | SGX | ~S$5B | ~20–22x | ~4.8–5.1% | ~50%+ premium |
| NTT DC REIT | SGX | ~US$1.6B | ~17x (IPO) | 7.5–7.8% | Near par |
| GDS C-REIT | SSE | ~RMB 2.3B | 16.9x | 5.2% | Near par |
| DigiCo REIT | ASX | ~A$1B | N/A | ~9.4% | Deep discount |
Category G: Private Equity Platforms — The Arena for Outsized Returns
Private equity has produced the most remarkable returns in contemporary alternative asset management within the data center sector. Transaction multiples have climbed from 24x EBITDA in 2020 to 25–30x+ in 2025, far exceeding the PE infrastructure average of 16x and meaningfully above public REIT multiples of 20–27x. In 2024 alone, over $108 billion in PE capital flowed into data center transactions.
Representative Companies
Blackstone has built the world's largest data center empire. Total portfolio: $700 billion (including under construction), with a $100 billion+ pipeline. Core asset QTS has seen leased capacity grow 8x since the 2021 acquisition at $10 billion. The A$24 billion (~US$16.1 billion) AirTrunk acquisition in 2024 was APAC's largest data center transaction and the year's largest leveraged buyout globally.
KKR: Data center enterprise value totaling over $300 billion. Core asset CyrusOne (acquired at $15 billion, 26.4x EBITDA), now 80+ facilities. February 2026: S$6.6 billion (~US$5.1 billion) acquisition of 82% of STT GDC (implied EV ~$10.9 billion; design capacity 2.3 GW).
BlackRock / GIP: The AI Infrastructure Partnership completed the $40 billion Aligned acquisition — the largest data center transaction ever. AIP comprises BlackRock, GIP, MGX, Microsoft, and NVIDIA, with anchor investors including Kuwait Investment Authority and Temasek. The target: $300 billion in equity mobilization (with debt capacity reaching $1 trillion).
Brookfield: Data center equity investments exceeding $5 billion, with ~485 MW+ of operating capacity. Core platforms include Data4 (Europe, ~$2.4 billion acquisition), Compass (~$5.5 billion). February 2025: announced €20 billion French AI infrastructure investment; November 2025: launched a $100 billion AI infrastructure plan.
Macquarie created two historic exits. AirTrunk: acquired at ~A$3 billion in 2020, sold at A$24 billion in 2024 — ~8x return in 4 years. Aligned: invested in 2018 when it had just 2 facilities and 85 MW; exited at $40 billion in 2025 — estimated 20x+ return over 7 years. Macquarie's CEO called the AirTrunk exit "just a warm-up."
| PE Firm | Core DC Assets | Acquisition / Investment | Est. Current Value | Landmark Deal |
|---|---|---|---|---|
| Blackstone | QTS, AirTrunk | $10B + A$24B | $700B portfolio | Plans listed acquisition vehicle |
| KKR | CyrusOne, STT GDC | $15B + $5.1B | $300B+ EV | STT GDC 2.3 GW |
| BlackRock / GIP | Aligned | $40B | $40B (new acquisition) | AIP alliance, $1T potential |
| Brookfield | Data4, Compass | $5.5B+ | 1.25 GW+ | €20B France commitment |
| DigitalBridge | Switch, Vantage | $9.2B (Vantage) | $108B AUM | Acquired by SoftBank for $4B |
| Macquarie | APLD, VIRTUS, et al. | Multiple | 4.3 GW | Two historic exits |
Section 1: Unit Economics Across All Six Categories
Fundamental Differences in Revenue Density, Cost Structure, and Margins
The unit economics of the six business models diverge fundamentally because their "products" occupy different positions on the value chain — from basic "powered space" to complex "compute capacity," per-MW revenue can vary by 5–10x.
| Core Metric | A: Retail Interconnection | B: Wholesale | C: Power-First | D: GPU Cloud | E: Hyperscaler Self-Build | F/G: Financial |
|---|---|---|---|---|---|---|
| Revenue per MW (annual) | $5–10M | $1.5–3M | $1.5–2M (shell only) | $15–25M | Internal cost center | Depends on underlying |
| Construction cost / MW (full-stack) | ~$16.3M | $10–12M | $4–6M (shell) + tenant equipment | $20M+ (incl. GPU) | $10–15M | N/A |
| EBITDA margin | 47–52% | 50–55% | 30–40% (shell) | 57–62% (adjusted) | 33–39% (cloud segment) | REIT 47–55% |
| Development yield | 9%+ | 8–12% (DLR ~11.9%) | 7.5–8.5% | Difficult to stabilize | N/A | N/A |
| WALT | 2–4 years | 8–15 years | 10–12 years | 3–5 years (contract) | N/A | Depends on underlying |
| Customer concentration (top 1 / top 5) | <5% / <15% | 20–40% / 60–80% | 30–50% / 70–90% | 62–67% / 77%+ | N/A | Diversified portfolio |
| Churn rate | 2–2.5% | <1% | ~0% (take-or-pay) | Very low (contract-locked) | N/A | N/A |
| Capital payback period | 3–5 years | 5–8 years | 7–10 years | 6–8 years (incl. GPU depreciation) | N/A | 3–7 years (PE exit cycle) |
U.S., China, and Asia-Pacific Unit Economics Comparison
| Market Metric | United States | China | Asia-Pacific (AUS/NZ/JP) |
|---|---|---|---|
| Wholesale rate | $184/kW/mo (2024 avg, +12.6% YoY) | RMB 1,200–2,000/kW/mo | A$180–220/kW/mo |
| Vacancy | 1.9% (H2 2024 historic low) | 15–25% (high inter-city variance) | 3–8% |
| EBITDA margin (top-tier) | 47–55% (EQIX/DLR) | 29–48% (VNET vs. GDS) | 50.5% (NEXTDC) |
| EV/EBITDA | 23–31x (public) | 16.9–24.6x (C-REIT) | 7–8% yield (newly listed) |
Section 2: Contract Structures and Financing Innovation
Five Fundamental Shifts in AI-Era Contract Design
AI demand is fundamentally rewriting the data center industry's contract paradigm. Traditional colocation contracts centered on "area × rate"; AI-era contracts are evolving toward "power × capacity × obligation."
| Feature | Retail (Cat. A) | Wholesale (Cat. B) | Power-First (Cat. C) | GPU Cloud (Cat. D) |
|---|---|---|---|---|
| Typical term | 1–5 years (auto-renew) | 5–25 years (NNN) | 7–12 years (take-or-pay) | 3–5 years (take-or-pay) |
| Pricing model | Per cabinet/kW/mo + interconnection | Per kW/mo (NNN) | Power pass-through + hosting fee | Per GPU-hour or monthly |
| Annual escalator | CPI or 2–3% | 3–4% (DLR new signs at 4%) | CPI + power cost pass-through | Typically fixed |
| Pre-lease rate | Low | 73–80% of under-construction pre-leased | Very high | N/A (contract-locked) |
CoreWeave's contract structure exemplifies Category D. As of end-2025, its contract backlog reaches $66.8 billion: OpenAI up to $22.4 billion, Meta $14.2 billion (through December 2031), Microsoft ~$10 billion (contributing 67% of revenue), and NVIDIA $6.3 billion capacity floor commitment (through April 2032). This take-or-pay structure supports massive debt financing — but extreme customer concentration is a double-edged sword.
Six Frontiers of Financing Innovation
1. REIT green bonds (Cat. A/B): Equinix has cumulatively issued approximately $9 billion in green bonds through June 2025, with an estimated greenium of 25–50 bps and lifecycle savings of approximately $30 million.
2. GPU asset-backed financing (Cat. D): CoreWeave's DDTL spread compression is the most striking innovation — from SOFR+9.62% (early DDTLs) to SOFR+2.25% (DDTL 4.0), roughly 700 bps of compression in under 2 years. DDTL 4.0 ($8.5 billion) received Moody's A3 rating — the first investment-grade GPU-backed financing.
3. CMBS securitization (Cat. B/G): QTS (Blackstone) issued $3.46 billion CMBS in November 2025 — the year's largest data center securitization. Average data center CMBS issuance has grown from $320 million/deal (2022) to $1.1 billion/deal (2025), representing 13% of all SASB issuance. Morgan Stanley projects data center ABS issuance growing from $8 billion (2025) to approximately $25 billion (2028).
4. Sustainability-linked financing (Cat. B): AirTrunk completed an A$16 billion refinancing — the largest sustainability-linked financing in APAC (excluding Japan), supported by 60+ banks.
5. Optimal leverage by model: REITs typically maintain 35–40% debt-to-total-enterprise, net debt/EBITDA 4.9–5.5x. PE platforms optimize to 55–65% debt / 35–45% equity. GPU cloud uses the most aggressive leverage — CoreWeave's debt/equity ratio is approximately 4.8x, with a current ratio of only 0.39.
Section 3: Moat Depth Ranking and AI-Era Erosion / Reinforcement
Six Categories Ranked from Deepest to Most Fragile
#1: Category E (Hyperscaler Self-Build) — Deepest moat. The top five hyperscalers' 2025 combined capex of approximately $443 billion (Amazon $131B, Google $85B, Microsoft $80B, Meta $64–72B, Oracle $20–25B), projected to reach $600–690 billion in 2026. This capital-scale barrier, combined with custom silicon (Google TPU, AWS Trainium, Meta MTIA delivering 40–65% TCO advantages) and data ecosystem lock-in, forms a virtually insurmountable composite moat.
#2: Category C (Power-First Development) — Most reinforced by AI. Power access is the industry's binding constraint. The U.S. grid interconnection queue contains approximately 10,300 projects (1,400 GW generation + 890 GW storage), but only 13% of projects entering the queue from 2000–2019 reached commercial operation, with median wait times extending from under 2 years to approximately 5 years. Morgan Stanley estimates a 1-year power timeline advantage is worth $3–4 million/MW. AI demand is projected to grow 3.5x by 2030 (McKinsey), far outpacing any conceivable grid expansion rate — deepening the power moat continuously.
#3: Category B (Wholesale Colocation) — Traditional moat deepened by power scarcity. Existing power connections and expansion rights provide 5–10 years of time-barrier advantage. U.S. major market vacancy fell to 1.9% by end of 2024, with under-construction capacity at 9,432 MW but largely pre-leased through 2027.
#4: Category A (Retail Interconnection) — Network-effect moat buoyed by AI inference. Equinix's 500,000+ interconnections constitute a genuine network-effect barrier, with customer churn of only 1–2%. However, interconnection growth has decelerated from 16.7% (2018) to 3.4% (2023). The positive factor: AI inference workloads increasingly require low-latency, distributed deployment — precisely matching Equinix's edge/metro footprint.
#5: Category F/G (Financial Layer — REIT/PE) — Replicable but structurally advantaged. REIT tax exemption and PE leverage flexibility are valuable but replicable financial structures. REITs face a core challenge: 90%+ distribution requirements constrain reinvestment capacity — particularly acute as AI-era capital intensity escalates sharply.
#6: Category D (GPU Cloud) — Most fragile moat. GPU procurement priority was a precious moat during 2023–2024's GPU shortage, but is eroding rapidly as Blackwell capacity expands and 300+ new H100 cloud suppliers enter. Technology iteration is an existential risk: NVIDIA's annual architecture cadence (Hopper → Blackwell → Rubin → Rubin Ultra) means hardware depreciates far faster than accounting recognizes — CoreWeave depreciates GPUs over 6 years, but economic life is approximately 3–4 years. H100 cloud lease prices have crashed from peak $7–10/hour to $2–4/hour (-60–70%).
Section 4: Profit Distribution Across the AI Data Center Value Chain
Value Concentrates Extremely Toward Chip Designers
The AI data center value chain exhibits a pronounced "smile curve," with upstream (chip design) margins dramatically exceeding downstream (application/platform) margins.
| Value Chain Layer | Representative Company | Gross Margin | Operating Margin | Market Share |
|---|---|---|---|---|
| Chip design | NVIDIA | 73–76% (GAAP) | ~55–60% | >80% of AI accelerator market |
| Chip fabrication | TSMC | 56–59% | 45–51% | >90% advanced process |
| GPU cloud platform | CoreWeave | 25–30% (incl. depreciation) | 0–2% (GAAP) | Neocloud market leader |
| DC shell (interconnection) | Equinix | ~69% (cash gross margin) | EBITDA 47–52% | #1 global retail colo |
| DC shell (pure shell) | Wholesale operators | — | EBITDA 30–40% | — |
NVIDIA FY2025 data center revenue reached $115.2 billion; total revenue $130.5 billion (+114%); net income $72.9 billion (55.8% net margin). H100 per-unit manufacturing cost is approximately $3,320 (die $300 + HBM3 $1,350 + packaging $750) vs. $28,000 selling price — ~88% per-unit margin. Processors account for over 60% of total AI infrastructure market spend.
Section 5: Differentiated Impact of Technology Iteration on the Six Models
The GPU Depreciation Time Bomb and the Liquid Cooling Transition
GPU technology iteration at annual cadence creates an unprecedented asset depreciation challenge. NVIDIA's architecture roadmap: Hopper (2022) → Blackwell (2024) → Blackwell Ultra / GB300 (H2 2025) → Rubin (H2 2026) → Rubin Ultra (2027). Each generation delivers massive performance-per-watt improvements: Blackwell achieves 25x tokens/watt over Hopper in inference.
The H100 residual value problem is emerging: secondary market prices sit at approximately 61% of new SXM pricing ($25,000–$30,000 vs. $40,000+ original). At $2.50/hour cloud lease rates, 10,000–12,000 hours (~14–16 months at 100% utilization) are needed to recoup purchase cost; below $1.65/hour, payback is mathematically impossible. Michael Burry has warned that the top five hyperscalers will cumulatively understate depreciation by $176 billion from 2026–2028.
Liquid cooling is an unavoidable transition. Air cooling reaches its physical limit at approximately 41 kW/rack. NVIDIA GB200 NVL72 racks require 120+ kW; future Vera Rubin targets 600 kW/rack; the industry expects 1 MW/rack within several years. The liquid cooling market is projected to grow from ~$4.9 billion (2024) to $15–21.3 billion by 2030 (CAGR 18–26%).
Differentiated impact ranking: Category C (Power-First) is least affected — power access rights are technology-agnostic, and cooling systems can be designed for any density. Category D (GPU Cloud) is most affected — the entire business model depends on GPU economics, with 6-year accounting depreciation vs. 3–4-year economic life creating systemic risk. Categories B and A fall in between — shell and power infrastructure can serve across GPU generations, though some facilities require costly liquid cooling retrofits. Approximately 68% of enterprise data centers built before 2015 lack AI-ready power and cooling capabilities, facing asset stranding risk.
Section 6: M&A Attractiveness — Five-Dimensional Scoring and Prioritization
Comprehensive M&A Attractiveness Assessment
| Dimension (5-point scale) | A: Retail | B: Wholesale | C: Power-First | D: GPU Cloud | E: Hyperscaler | F: REIT | G: PE |
|---|---|---|---|---|---|---|---|
| Revenue predictability | ★★★★ | ★★★★★ | ★★★★ | ★★★ | N/A | ★★★★ | ★★★★ |
| Capital efficiency | ★★★★ | ★★★ | ★★ | ★ | N/A | ★★★ | ★★★★★ |
| Scale effects | ★★★ | ★★★★★ | ★★★★ | ★★★ | ★★★★★ | ★★★★ | ★★★★★ |
| Technology risk (high = low risk) | ★★★★★ | ★★★★ | ★★★ | ★ | ★★★★ | ★★★★ | ★★★ |
| Customer concentration (high = low) | ★★★★★ | ★★ | ★★ | ★ | N/A | ★★★★ | ★★★ |
| Overall M&A attractiveness | Top pick | Runner-up | High potential | High risk / high reward | Not a target | Liquidity vehicle | Alpha arena |
Key M&A Transaction Multiples Reference
| Transaction | Buyer | Amount | Year | EBITDA Multiple | Category |
|---|---|---|---|---|---|
| Aligned / AIP-BlackRock | BlackRock/GIP/MGX/MSFT/NVDA/xAI | $40B | 2025 | ~40x revenue | C |
| AirTrunk / Blackstone+CPP | Blackstone | A$24B ($16.1B) | 2024 | ~30x | B |
| CyrusOne / KKR+GIP | KKR | $15B | 2021/22 | ~26.4x | B |
| Switch / DigitalBridge+IFM | DigitalBridge | $11B | 2022 | — | B→C |
| CoreSite / American Tower | AMT | $10.1B | 2021/22 | ~27–29x | A |
| QTS / Blackstone | Blackstone | $10B | 2021 | ~25x (now $700B+ value) | B |
| Vantage / DigitalBridge+Silver Lake | DigitalBridge | $9.2B equity | 2024 | — | B |
Public vs. private market multiples: As of early 2025, public data center EV/EBITDA is approximately 30.9x (spot), LTM average 28.1x, 3-year average 26.3x. Private transactions price at 25–30x EBITDA, but top-tier assets (AirTrunk, Aligned) have broken 30x, reflecting AI growth capex optionality and power asset scarcity premiums.
Five Transformation Case Studies
Case 1: Equinix xScale (A → B extension). Through JV structures with GIC/CPP, Equinix entered the hyperscale wholesale market. The October 2024 U.S. JV deployed $15+ billion in capital (GIC 37.5%, CPP 37.5%, Equinix 25%), targeting 1.5 GW of U.S. capacity. Equinix contributes just 20–25% equity but provides operational expertise and customer relationships — asset-light expansion creating a flywheel where hyperscale xScale deployments pull interconnection revenue into adjacent IBX facilities.
Case 2: QTS PE value creation (Cat. B, $10B → $700B+). After Blackstone's 2021 acquisition at ~$10 billion (25x EBITDA), four levers drove approximately 7x value creation: 8x+ capacity expansion to 3+ GW, geographic expansion ($8.2 billion Spain investment), long-term NNN lease lock-in with hyperscale customers, and innovative financing including $3.46 billion CMBS.
Case 3: CoreWeave (crypto miner → Cat. D GPU cloud). The transformation from 2017's Atlantic Crypto to $5.1 billion in 2025 revenue is the industry's most dramatic business model pivot — 320x revenue growth in three years. Key catalyst: ChatGPT's 2022 release and NVIDIA's deep partnership ($2 billion equity investment + $6.3 billion floor commitment). However, IPO pricing at $40 fell below the $47–55 target range, reflecting market concerns about Microsoft's 67% revenue concentration, $14 billion+ debt, and GPU depreciation risk.
Case 4: Switch EVO AI Factory (B → C upgrade). Post-acquisition by DigitalBridge+IFM for $11 billion, Switch leveraged Rob Roy's 500+ patented cooling technologies to develop the EVO AI Factory — supporting up to 2 MW/rack power density, 5 fluid cooling systems, and NVIDIA Omniverse digital twin integration. This demonstrates how traditional wholesale operators can upgrade to AI-ready power-first positioning through proprietary cooling technology and strategic partnerships.
Section 7: Clear Priority Recommendations for M&A Decision-Makers
What Each Category's Acquirers Should Prioritize
Category A (Retail Interconnection) — Best "steady-state" target. Prioritize facilities with high interconnection density (100+ cross-connects per customer), abundant Cloud On-Ramps, and >90% occupancy with pricing power. Key metrics: interconnection revenue share (ideal >25%) and revenue per cabinet. Highly dispersed customer bases (Equinix: 10,000+ customers) and 93%+ recurring revenue provide exceptional defensiveness. Reference multiple: 27–30x EBITDA.
Category B (Wholesale) — Best "scale + predictability" target. Prioritize platforms with GW-scale power pipelines, 10–20-year investment-grade tenant NNN leases, and geographic diversification. Key metrics: signed backlog, power pipeline (MW), WALT. Reference multiple: 25–30x EBITDA. Avoid single-market operators with near-term lease expiration risk.
Category C (Power-First) — Highest potential, but demands careful pricing. The scarce core asset is power, not buildings. Prioritize operators with GW+ secured power rights, proprietary liquid cooling technology (50+ kW/rack capability), and deep utility relationships. Caution: Aligned's ~40x revenue valuation suggests market sentiment may be overheating. Ensure power rights have long-term defensibility.
Category D (GPU Cloud) — Extremely high risk; extreme caution required. If investing, prioritize customer diversification (CoreWeave's 67% concentration is the negative case study), long-term backlog ($66.8 billion is impressive but highly concentrated), and early NVIDIA access relationships. Must avoid: operators dependent on a single GPU generation, high-leverage structures with depreciating-asset collateral (CoreWeave's 11–14% interest rate debt secured by GPUs), and pure GPU cloud players without diversification paths. This is not infrastructure — it is a technology asset with infrastructure characteristics.
Category F/G (Financial Layer) — Exploit valuation arbitrage. REIT investors should focus on geographic valuation differences: U.S. (27–31x) vs. Asia-Pacific (7–8% yield) vs. China C-REIT (16.9x). PE's success formula: enter at 25–30x EBITDA → operational expansion (QTS model can deliver 8x capacity growth) → leverage Blackstone/KKR-tier cost-of-capital advantages → exit at 30–40x+. Avoid chasing late-cycle high multiples without a clear value creation thesis.
Conclusion: Three Contrarian Judgments
First, power barriers are overtaking network effects as the data center industry's primary moat. Against the backdrop of AI-driven power demand explosion, Equinix's prized 500,000 interconnections are undoubtedly valuable, but Aligned's 5 GW power reserves carry greater weight in its $40 billion valuation. The irreversibility of power access (5–10-year grid queues) versus the replicability of interconnection (hyperscalers can build their own Cloud On-Ramps) makes Category C's moat more durable than Category A's.
Second, GPU cloud's "high-growth narrative" masks a harsh capital return reality. CoreWeave's adjusted EBITDA margin of 60% appears impressive, but true gross margin (including GPU depreciation) is only 25–30%, GAAP operating margin hovers at 0–2%, and net margin is -23%. The mismatch between 6-year GPU depreciation and 3–4-year economic life, $14 billion in debt with $1.1 billion in annual interest, and Microsoft's 67% revenue concentration make Category D the highest-risk investment target among the six — though potentially the highest-returning.
Third, the private-vs-public valuation arbitrage window is narrowing but remains significant. QTS's 3-year, 7x value creation from $10 billion to $700 billion+ is PE's benchmark case in data centers, but current entry multiples of 25–30x EBITDA are far above levels of five years ago, and both power and construction costs are rising. Future PE outperformance will derive more from operational optimization and AI capacity monetization than from simple multiple expansion. Platforms commanding GW-scale power pipelines and liquid cooling capabilities will be the most strategically valuable targets in the next M&A cycle.