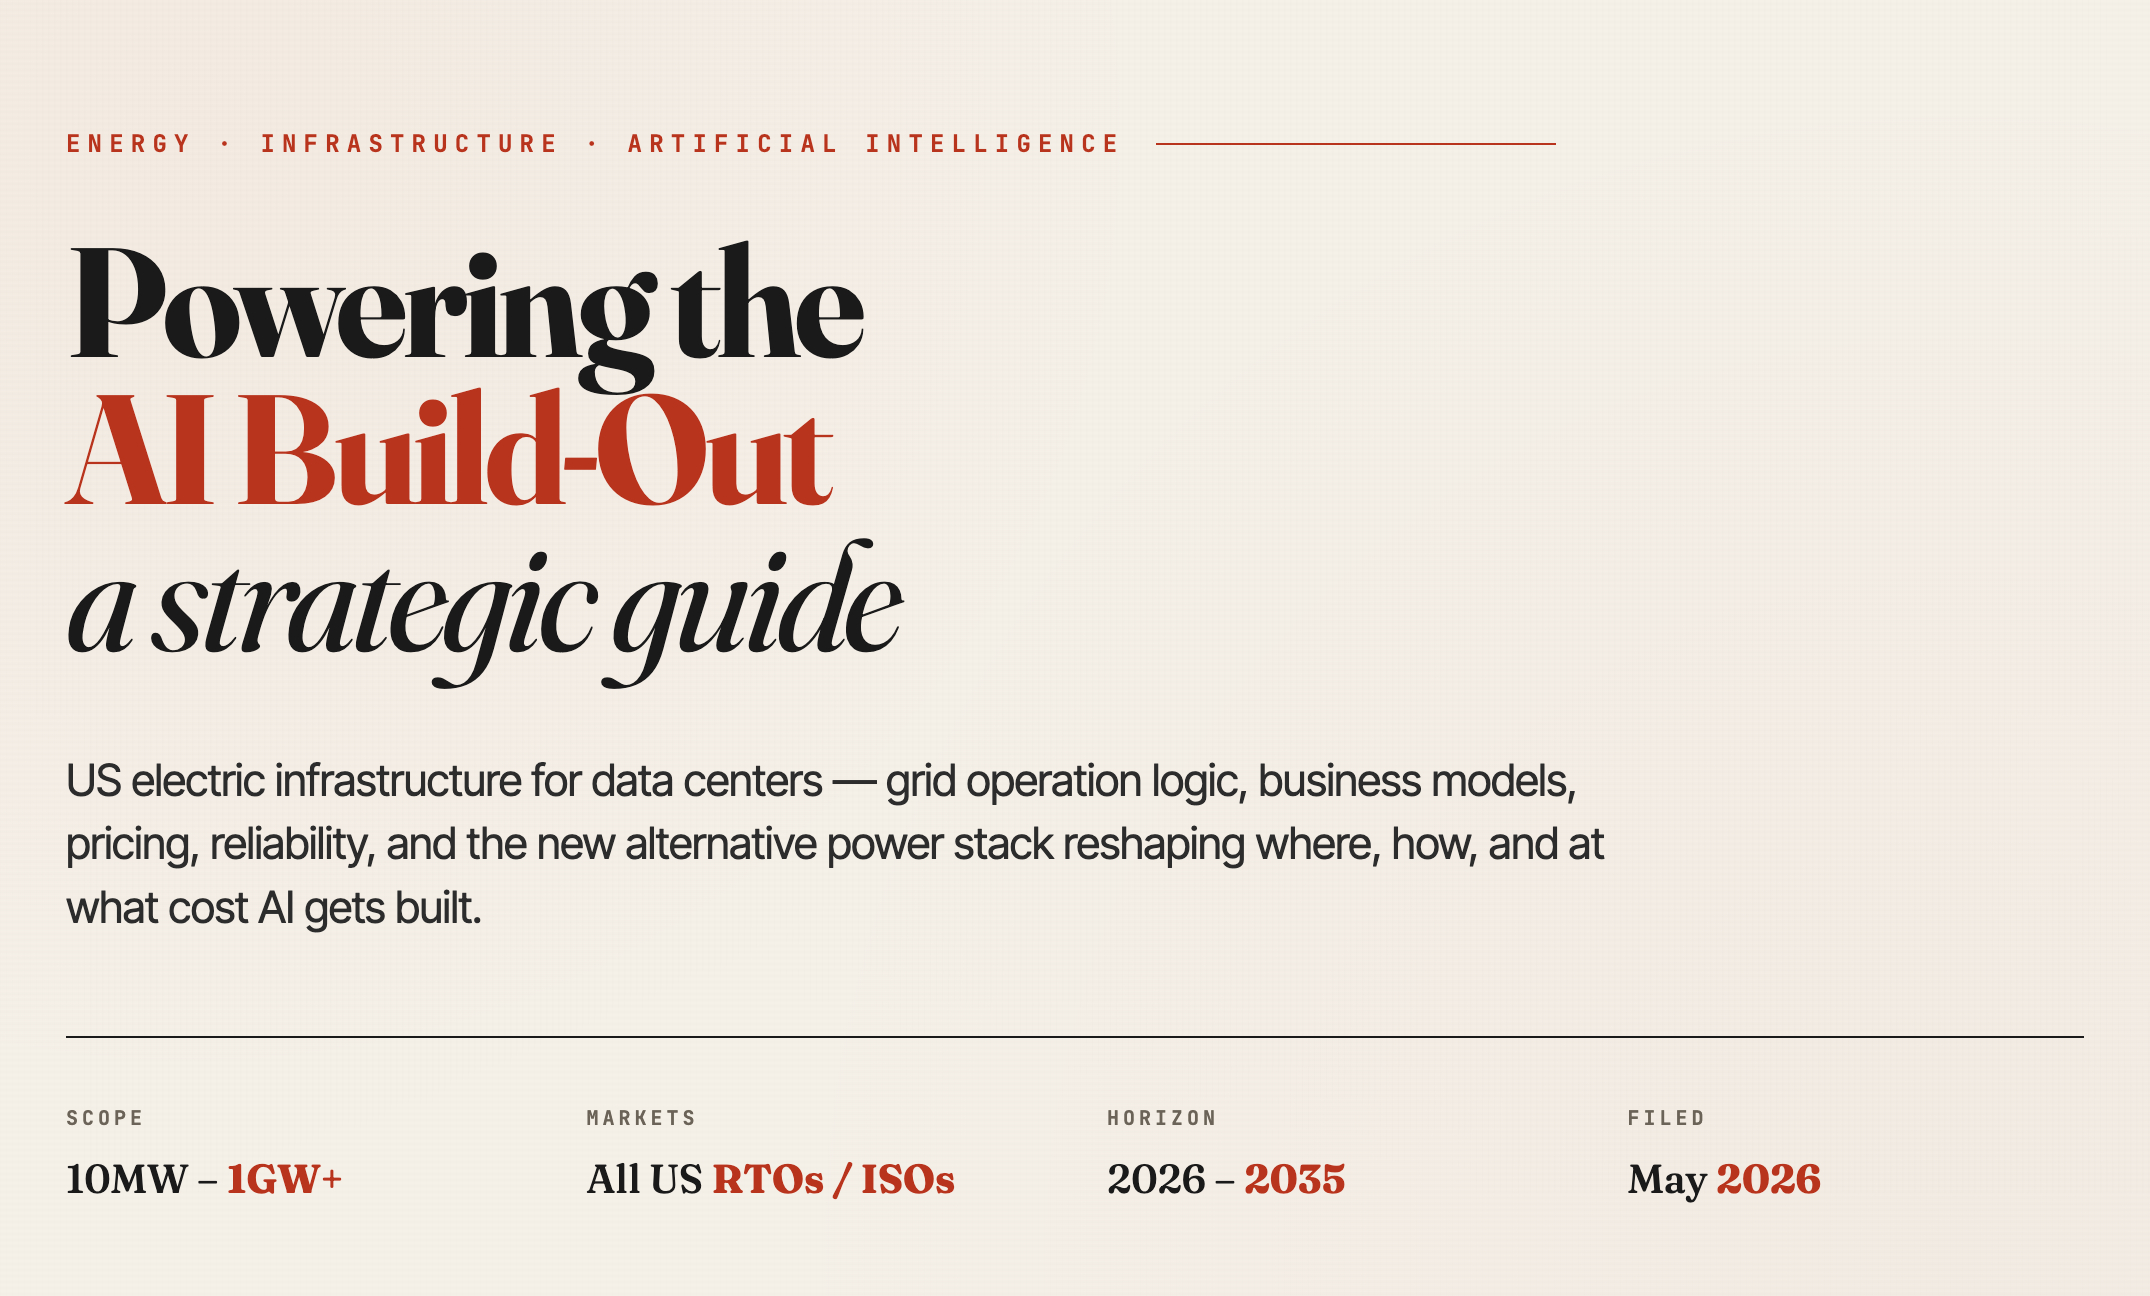
The misaligned global distribution of five foundational resources — power, water, network, land, and climate — is profoundly reshaping the siting landscape for hyperscalers. Today, the capacity ceiling of an AI factory is no longer dictated unilaterally by a builder's capital or chip procurement volume. Instead, it is entangled in a multi-dimensional matrix of physical constraints and regulatory frameworks: its lifeline is firmly held by grid operators and transformer manufacturers (Power); it is subject to the ecological quotas of water-rights authorities (Water), the bandwidth topologies of backbone networks and submarine cable consortia (Network), and the zoning laws and NIMBY politics of local councils (Land); and ultimately, it must yield to the laws of thermodynamics and stringent ESG carbon standards (Climate).
Hyperscalers (Microsoft, Amazon, Google, Meta, Oracle) are signing multi-decade nuclear and natural gas deals at scale, while mid-tier colocation operators continue to rely on conventional utility tariffs.
The U.S. Power System
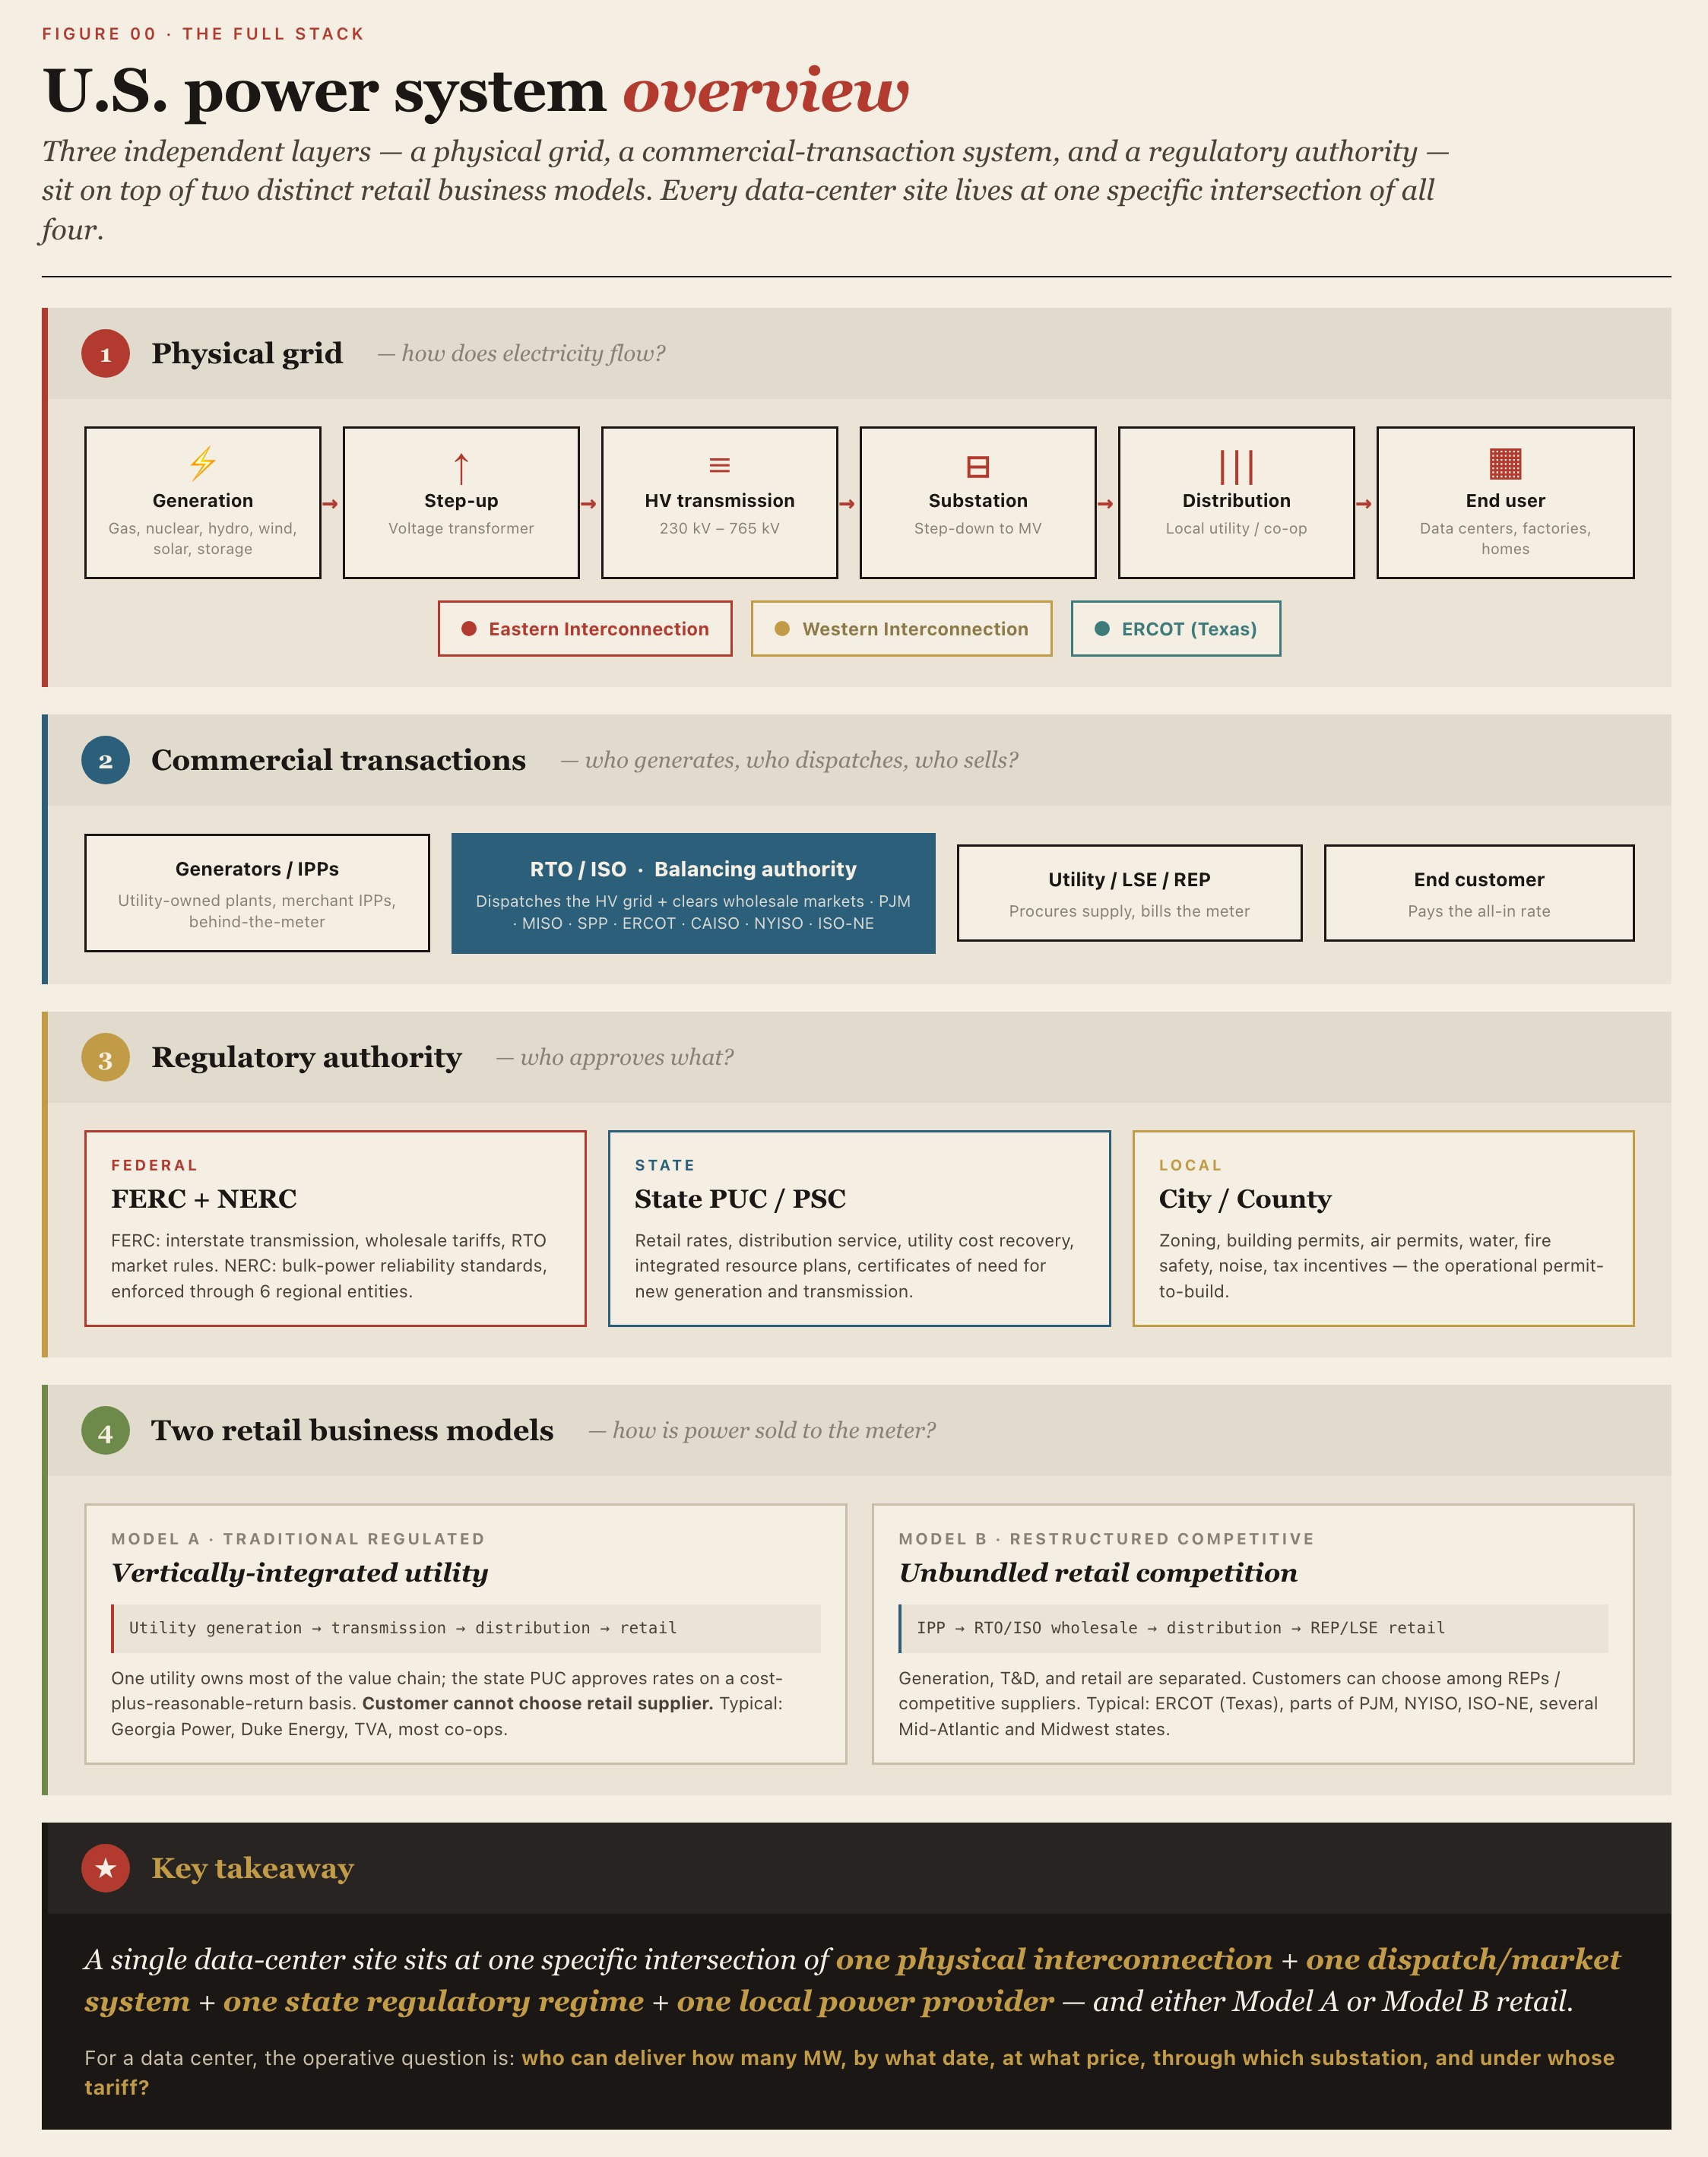
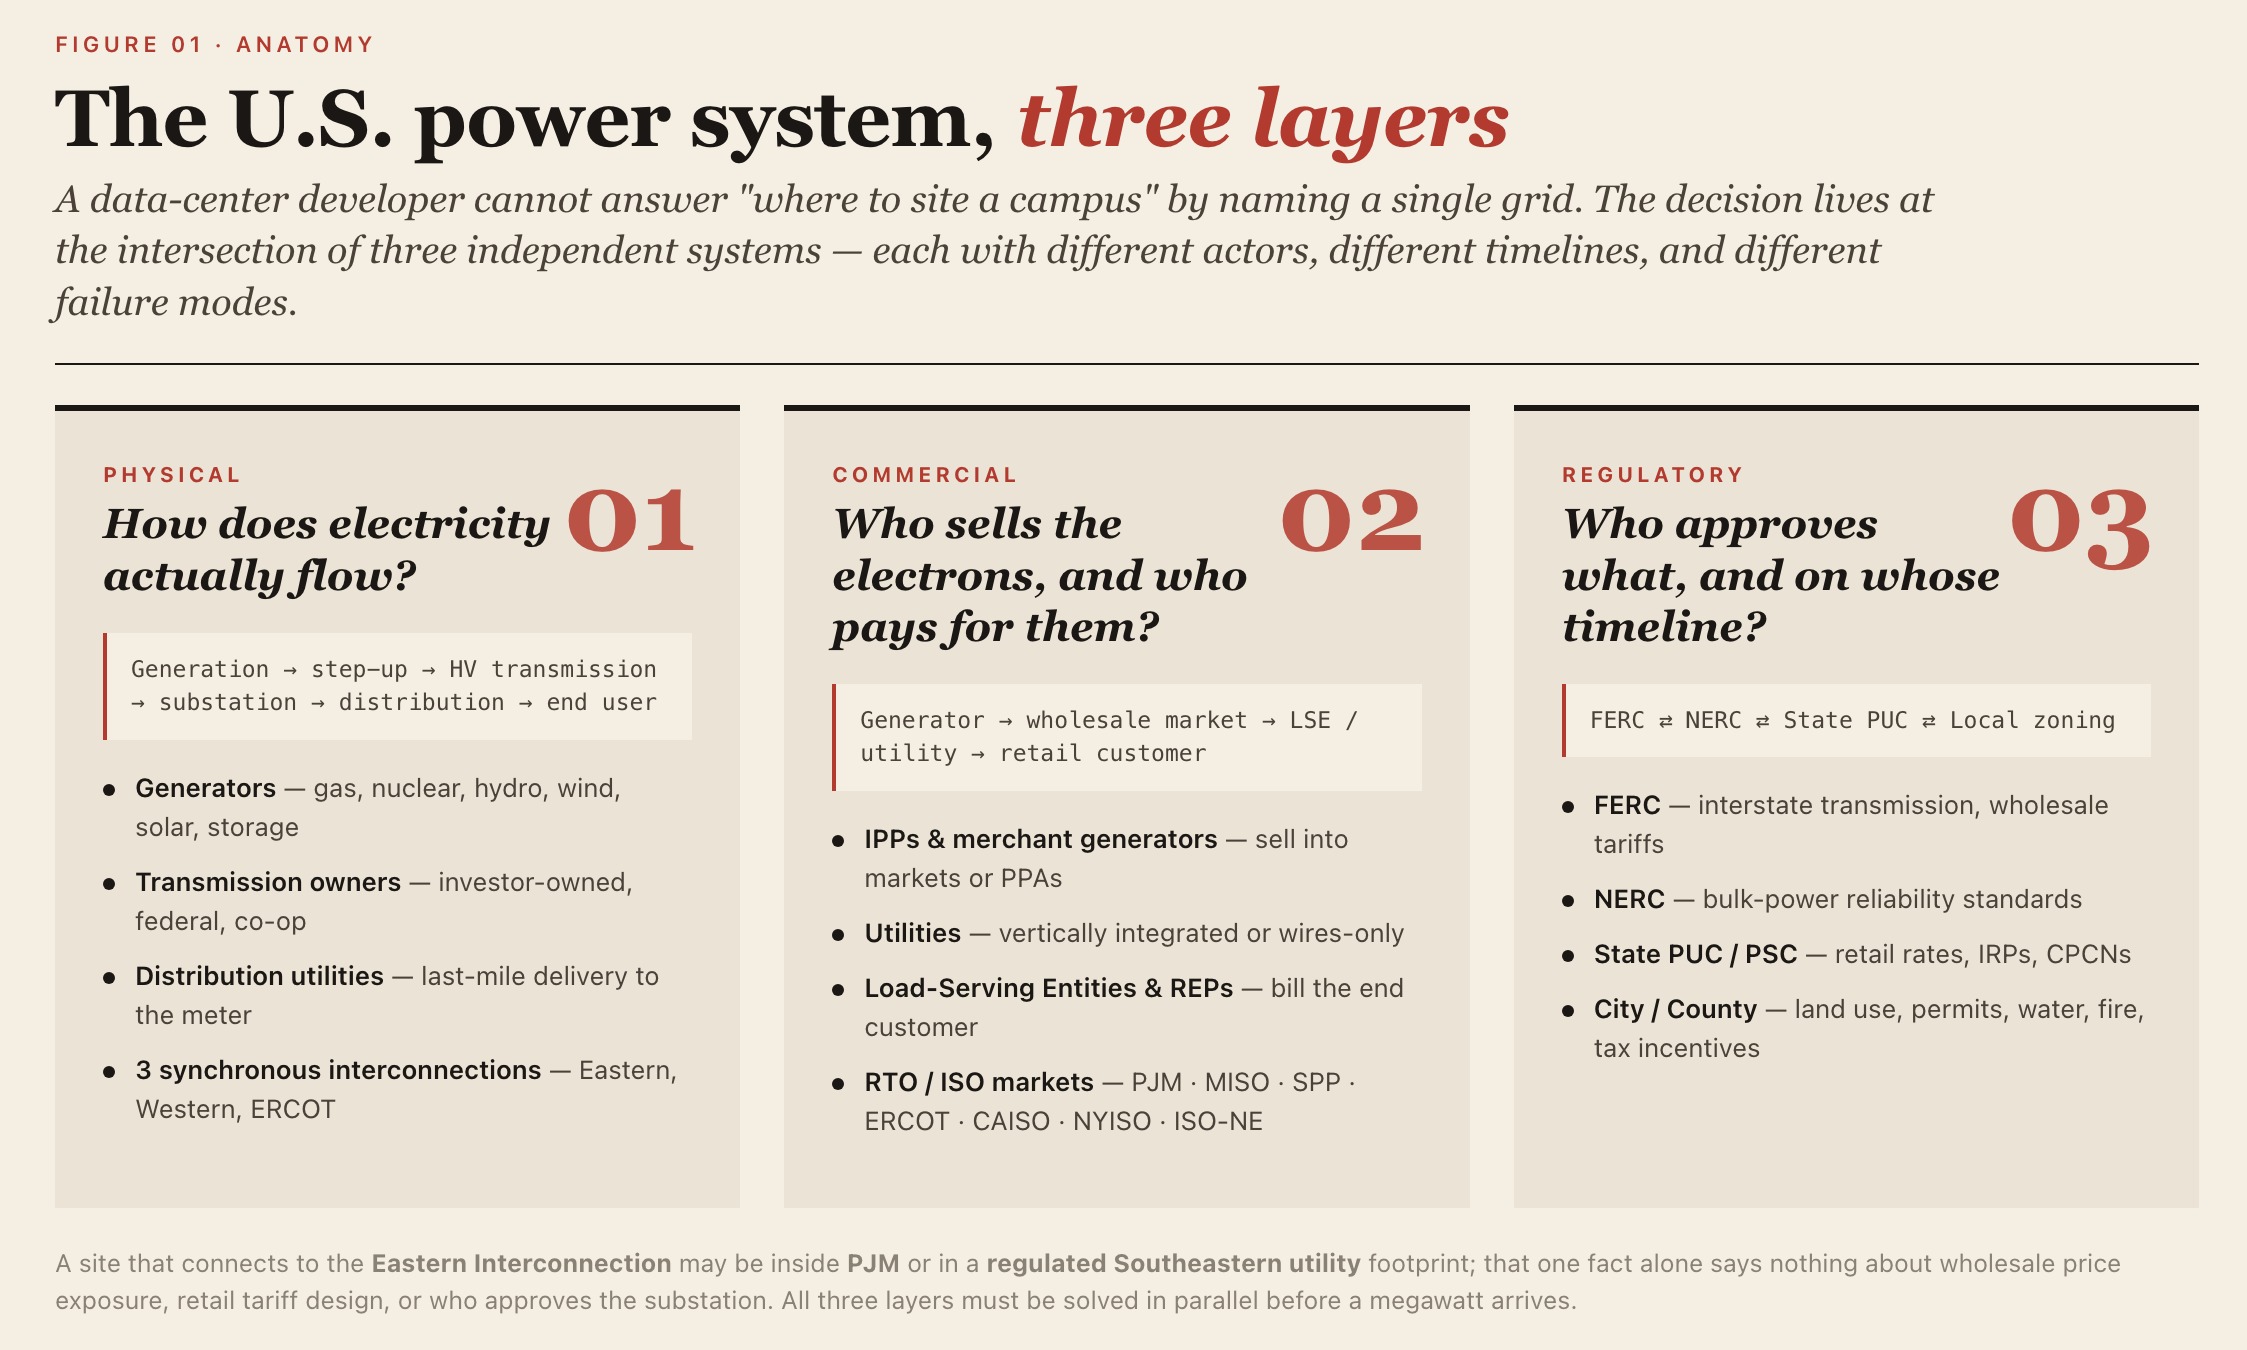
The U.S. power system is not a single national entity that owns generation, dispatches load, and bills customers under one roof. It is a multi-layered structure composed of the physical grid, wholesale markets, retail supply, interstate regulation, intrastate regulation, and local permitting. For a data-center developer, the key to understanding the U.S. power system is not simply identifying "which grid a site belongs to," but answering three questions simultaneously: how does electricity flow physically, how is it traded commercially, and who regulates the infrastructure?
The first is the physical-grid layer, which answers: where is power generated, through which lines and substations does it flow, and how does it ultimately reach the end user. It corresponds to the physical chain of generation, step-up transformation, high-voltage transmission, substation step-down, distribution, and end-use consumption.
The second is the commercial-transaction layer, which answers: who generates power, who buys it, who sells it, and who bills the end customer. It corresponds to the contractual and settlement relationships among generators, utilities, independent power producers, wholesale markets, retail suppliers, load-serving entities, and end customers.
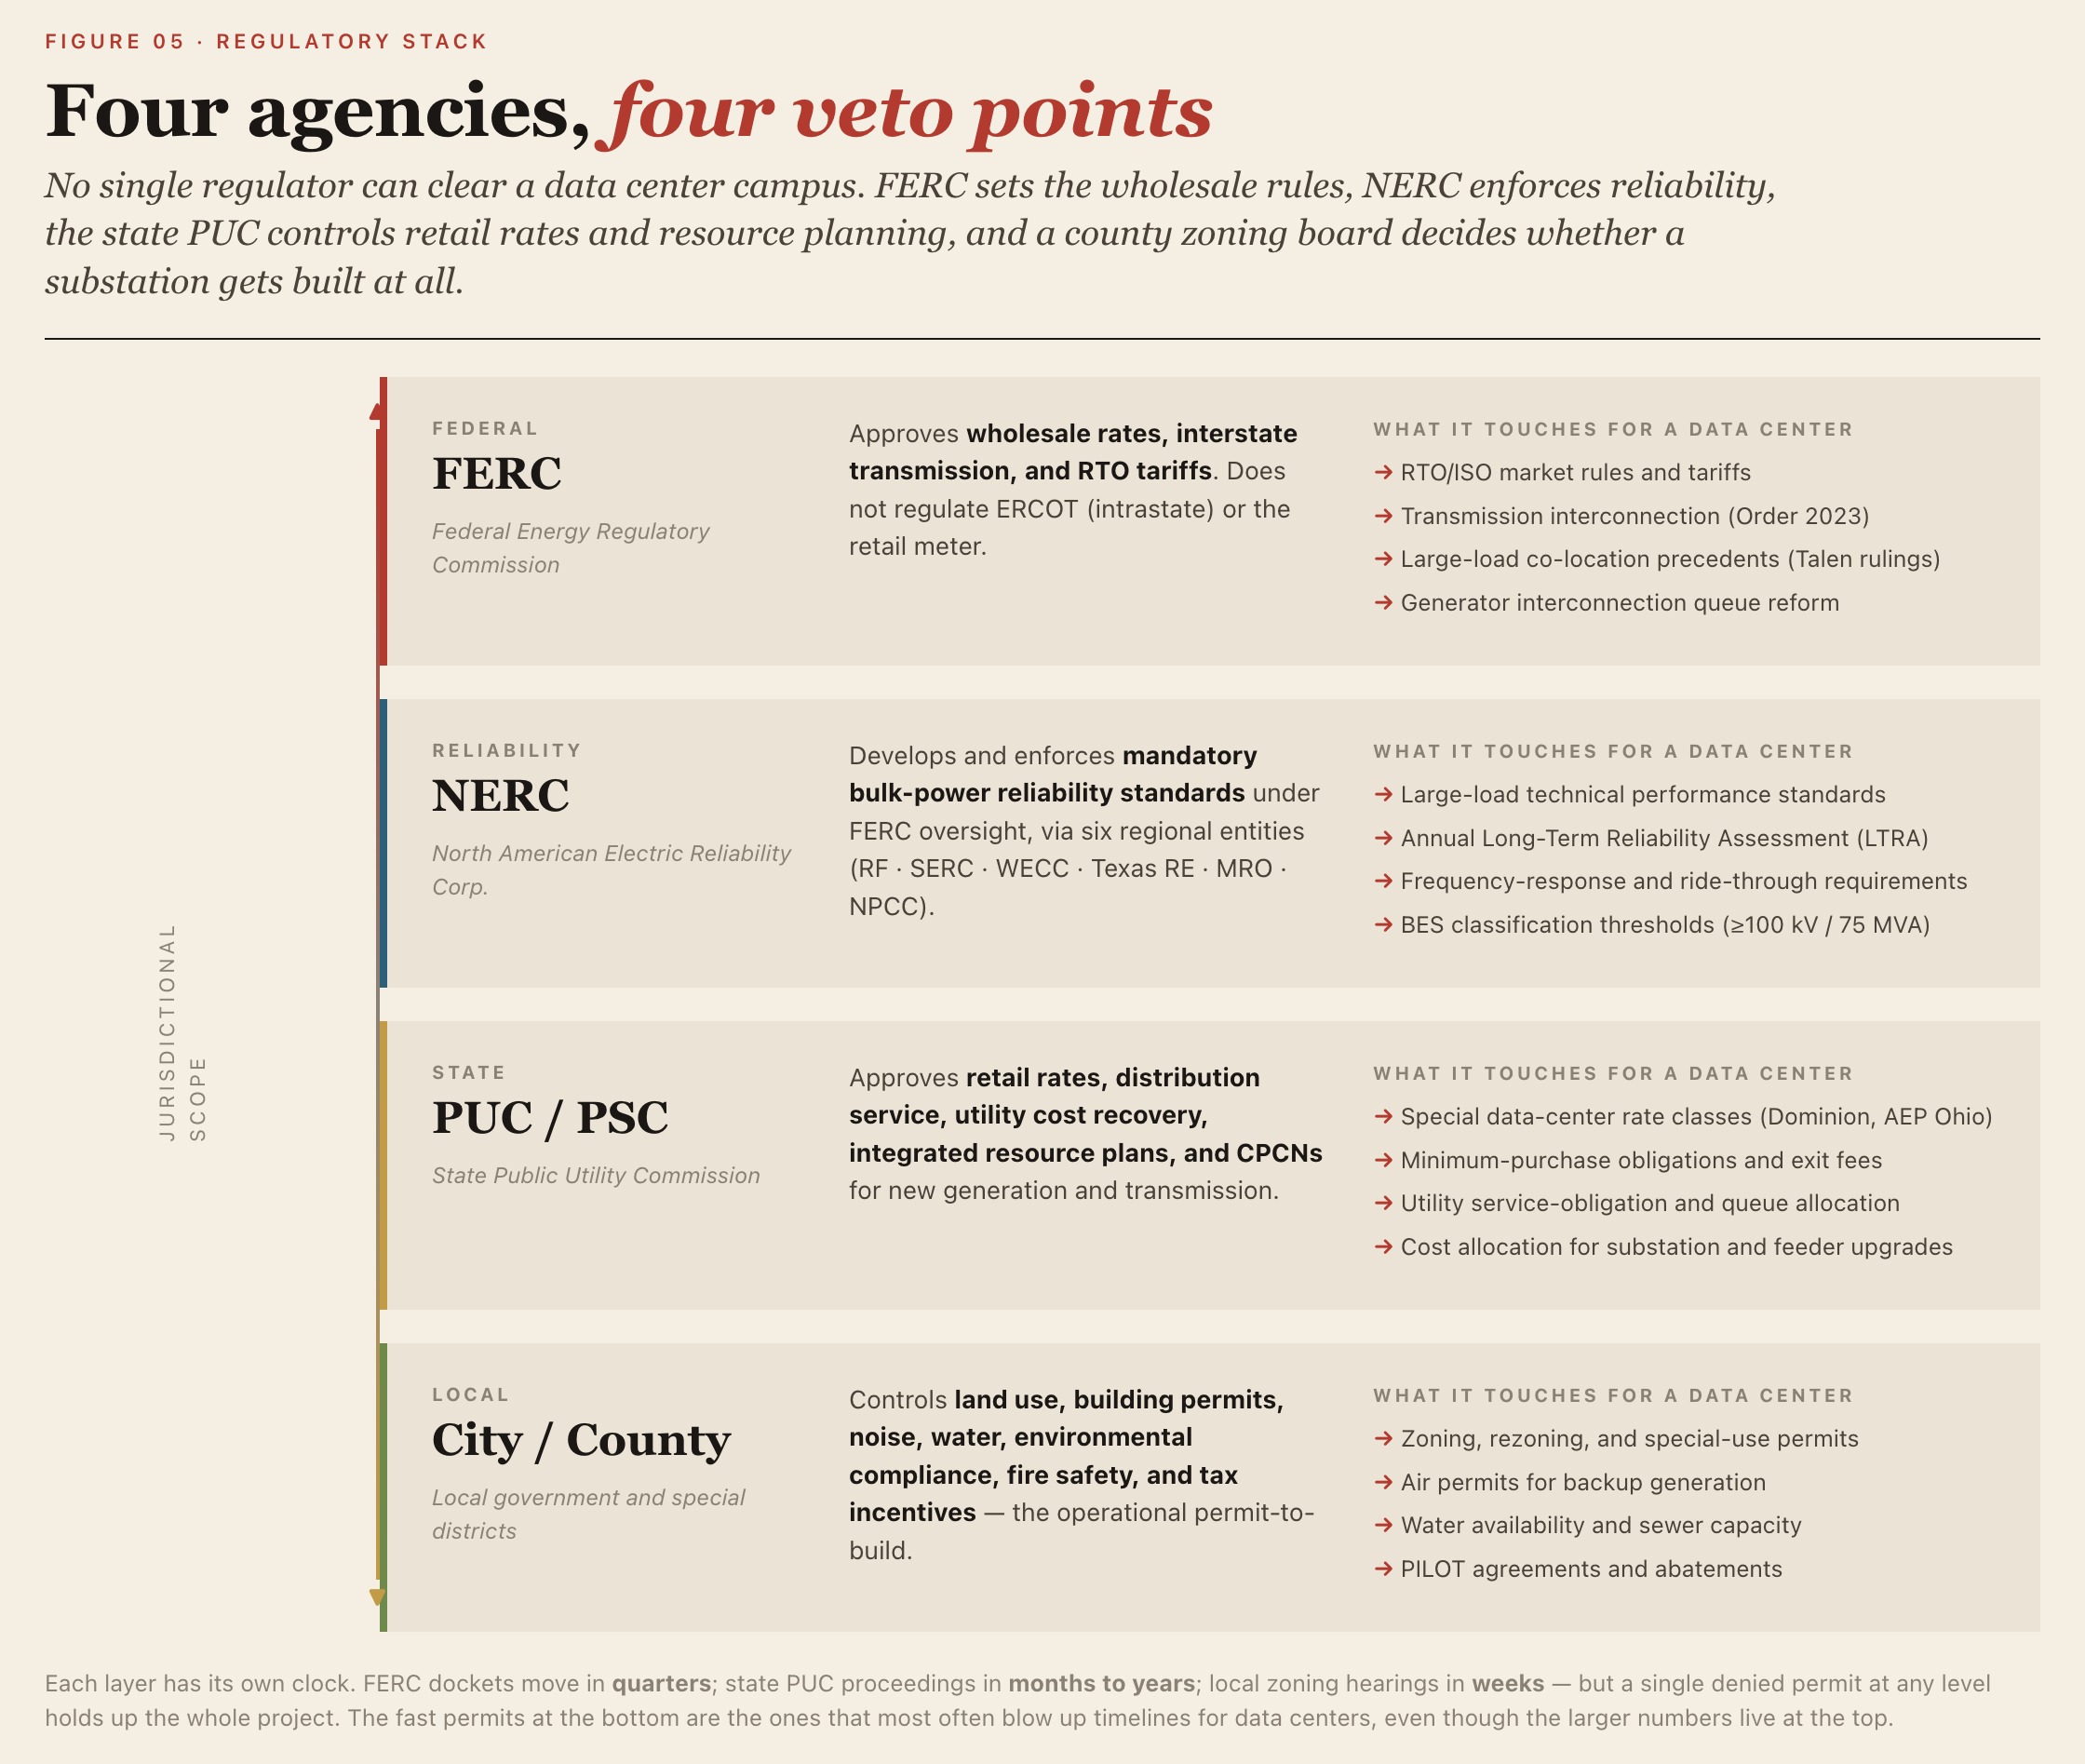
The third is the regulatory-authority layer, which answers: who approves wholesale market rules, who approves retail rates, who is responsible for reliability standards, and who approves local construction and land use. It corresponds to the allocation of responsibilities among FERC, NERC, state PUCs/PSCs, RTOs/ISOs, and local governments.
The Physical Grid
Viewed as a physical supply chain, the power system can be simplified to:
Generation → Step-up → High-voltage transmission → Substation step-down → Distribution → End user
The generation side may include natural gas plants, coal plants, nuclear plants, hydropower, wind farms, solar PV, and battery storage — or behind-the-meter resources built by data centers themselves, such as on-site gas turbines, fuel cells, or microgrids. The output typically passes through a step-up substation to raise voltage for long-distance transmission over the high-voltage network. It then reaches a substation near the load center for step-down, before being distributed over the local network to factories, residences, commercial buildings, or data-center campuses.
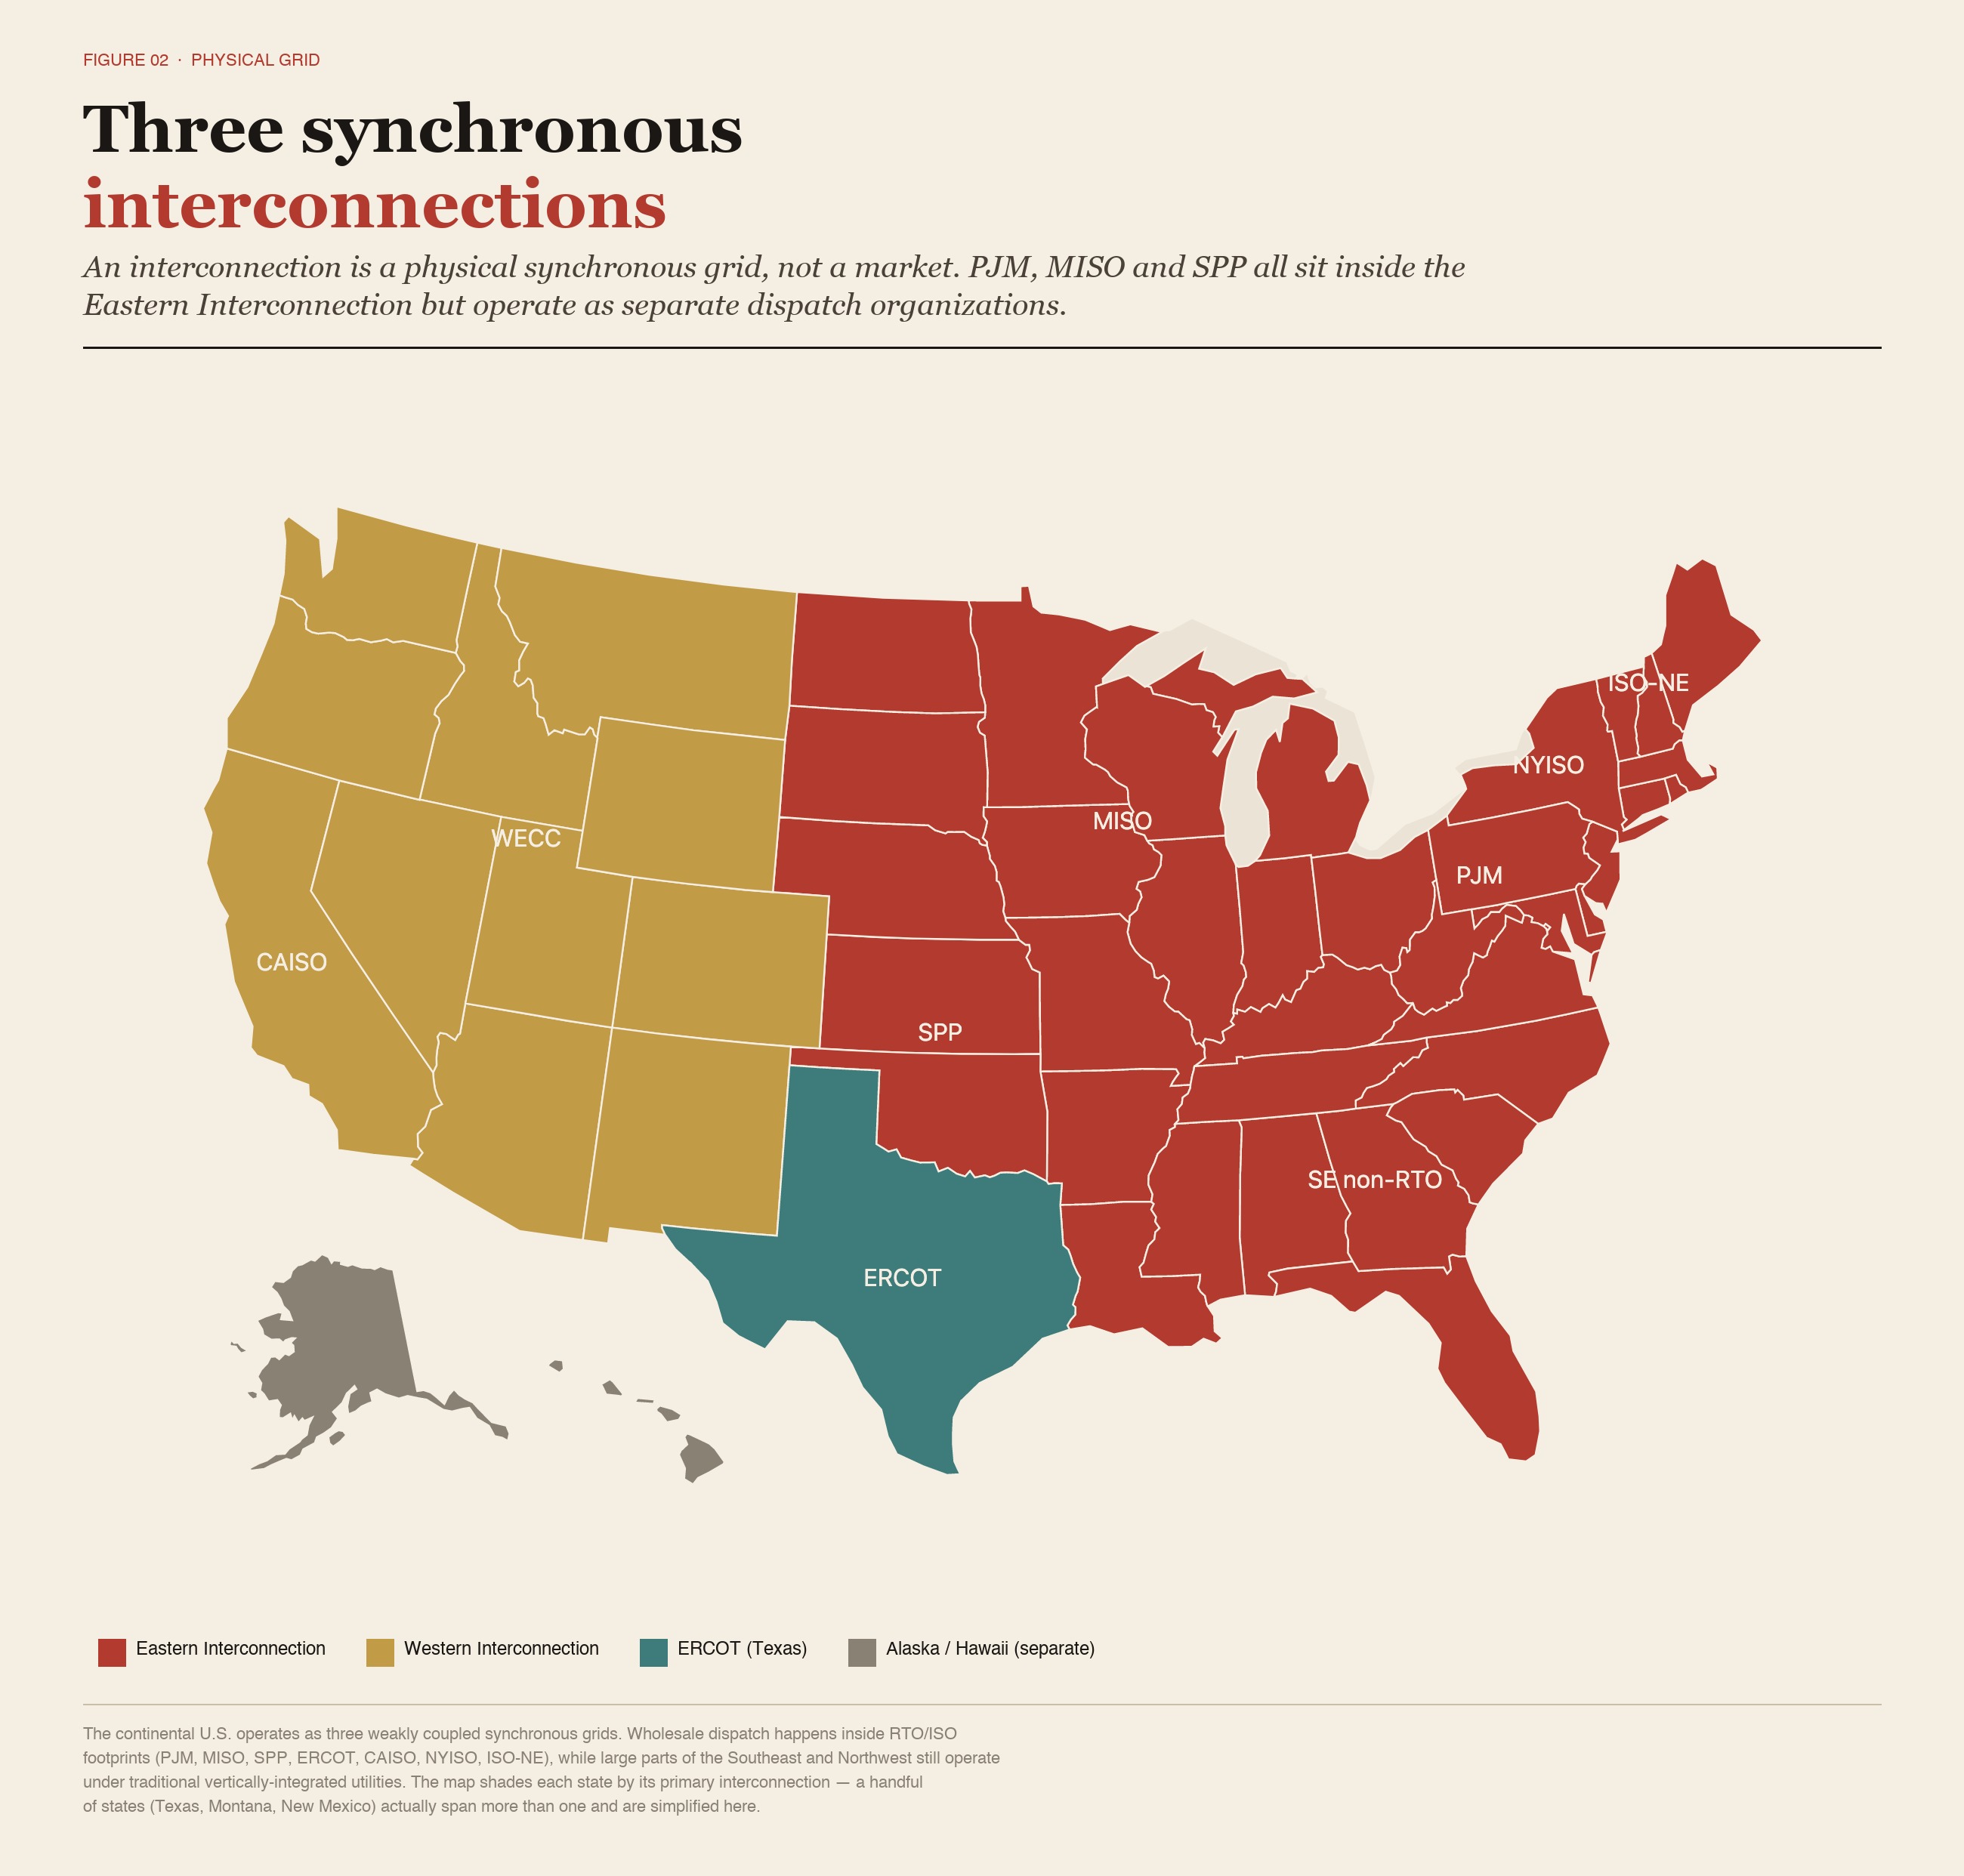
At the highest level, the physical grid of the continental U.S. is divided into three major synchronous interconnections:
| Physical interconnection | Description |
|---|---|
| Eastern Interconnection | Covers most of the eastern U.S.; home to PJM, MISO, SPP, and traditional Southeastern utility territories |
| Western Interconnection | Covers most of the western U.S., including CAISO, BPA, and multiple Western utility systems |
| ERCOT / Texas Interconnection | Covers most of Texas; operates as a largely independent synchronous grid |
An interconnection is a physical synchronous grid — not a company, and not a power market. PJM, MISO, and SPP all sit inside the Eastern Interconnection but are distinct dispatch and market organizations. Likewise, Southeastern utilities such as Georgia Power also operate within the Eastern Interconnection, yet that does not mean they belong to PJM or ERCOT.
In short, "which grid a site connects to physically" is only the first-order question. The answer defines the boundary for synchronous operation but does not by itself tell you who sells the power, who bills for it, or who approves the rates.
The Commercial Layer
Dispatch and Wholesale Markets
The power system must continuously maintain in real time:
Generation = Demand + Network losses
Because electricity cannot be stored cheaply at large scale over long horizons, the system must be balanced continuously. This task is carried out by balancing authorities, RTOs/ISOs, or utility control centers.
Across much of the U.S., high-voltage transmission dispatch and wholesale markets are run by RTOs/ISOs. RTO stands for Regional Transmission Organization; ISO stands for Independent System Operator. The two are functionally similar, with the following core responsibilities:
| Responsibility | Description |
|---|---|
| High-voltage transmission dispatch | Maintain regional supply/demand balance in real time, avoiding line overloads and system instability |
| Wholesale electricity markets | Operate day-ahead, real-time, and ancillary-service markets; some regions also operate capacity markets |
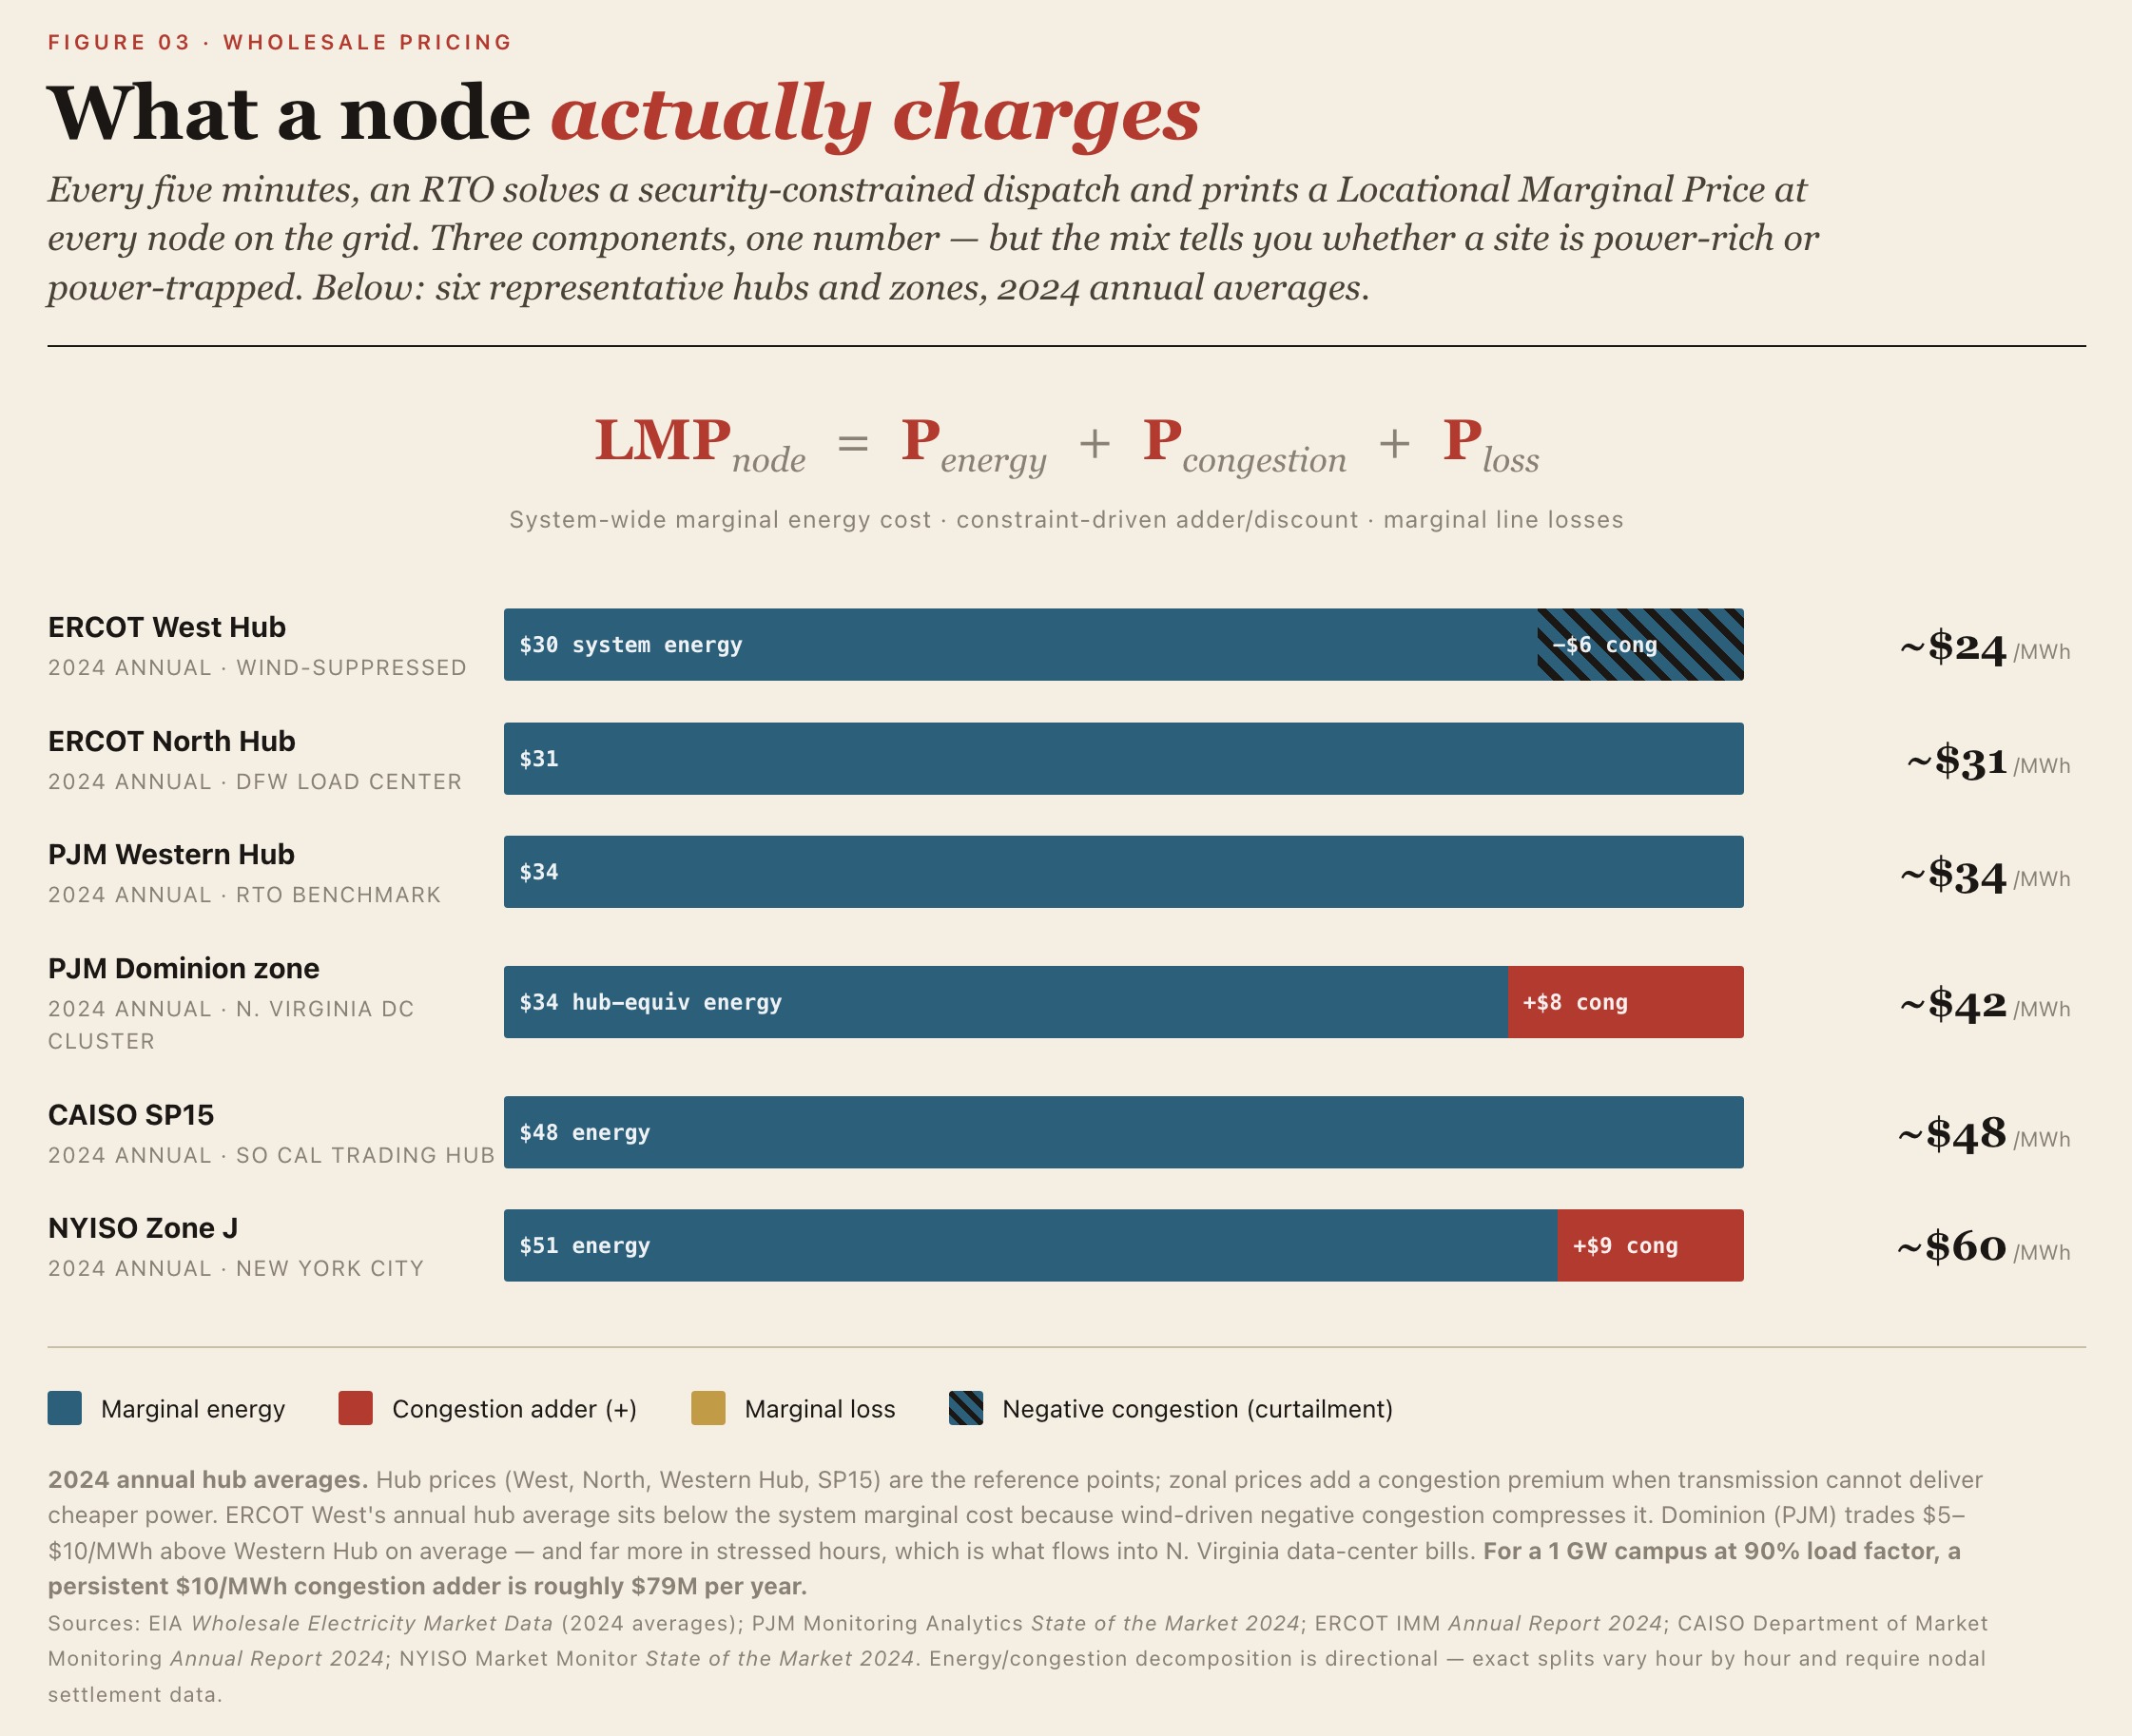
| Nodal price formation | Reflect energy, congestion, and loss costs through Locational Marginal Prices (LMPs) |
| Transmission planning | Assess long-term load growth, transmission bottlenecks, and the need for new lines |
| Interconnection process | Manage generation interconnection and, in some regions, large-load interconnection studies |
| Reliability coordination | Coordinate with NERC and regional entities to maintain bulk-system reliability |
Major RTOs/ISOs include PJM, MISO, SPP, CAISO, NYISO, ISO-NE, and ERCOT. They generally do not own power plants and do not bill residential or commercial customers directly. They function more as dispatchers of the high-voltage grid, operators of the wholesale market, and coordinators of regional transmission planning.
For data centers, the RTO/ISO matters because it determines or influences regional wholesale prices, transmission congestion costs, capacity costs, interconnection queues, large-load study processes, and the allocation of transmission upgrade costs.
The wholesale layer is where generators, utilities, load-serving entities, large customers, and market operators interact. Participants include:
| Entity | Role |
|---|---|
| Utility-owned generation | Generation assets owned or controlled by a utility |
| IPP | Independent Power Producer — owns generation but typically does not own distribution or end customers |
| Merchant generator | Market-based generator whose revenue comes primarily from wholesale prices |
| LSE | Load Serving Entity, responsible for procuring power for end load |
| RTO/ISO | Clearing and dispatch platform for wholesale markets |
| Large customer / hyperscaler | Large data centers may procure via PPAs, dedicated lines, behind-the-meter resources, or wholesale contracts |
An IPP can sell into wholesale markets such as PJM, SPP, MISO, or ERCOT, or sign long-term PPAs with Google, Microsoft, Amazon, Meta, utilities, or other customers. In short, an IPP sells electrons; an RTO/ISO dispatches the market. They are entirely different types of entities.
LMP — Locational Marginal Price — represents the cost of serving the next megawatt of load at a specific point ("node") on the grid. It is a composite price, typically expressed as:
Where
RTO/ISO markets feature several interlocking mechanisms:
- Day-ahead market: a financial market in which participants buy and sell next-day power at known prices based on forecasted load. Roughly 95% of energy is settled in this forward market, allowing buyers to hedge against price volatility.
- Real-time (5-minute) market: balances actual deviations, setting LMPs at each node (energy + congestion + losses).
- Capacity market (PJM, NYISO, ISO-NE, MISO): pays generators a $/MW-day to be available three years ahead.
- Ancillary services: regulation, spinning and non-spinning reserves, frequency response, voltage support — a growing revenue stream for batteries.
Retail Layer: Who Sells to the End User
The retail layer sits between the seller and the end user. End users include residential customers, commercial buildings, factories, and data centers.
In traditionally regulated markets, end users typically buy power directly from a local utility, cooperative, or municipal electric company. In restructured competitive markets, end users may choose among Retail Electric Providers (REPs) or competitive suppliers, but the local distribution company still physically delivers the power.
It is therefore important to distinguish among:
Physical delivery:        local utility / distribution company / co-op
Retail commercial seller: utility / REP / LSE
Wholesale dispatcher:     RTO / ISO / Balancing Authority
Generation owner:         utility-owned generation / IPP / merchant generator
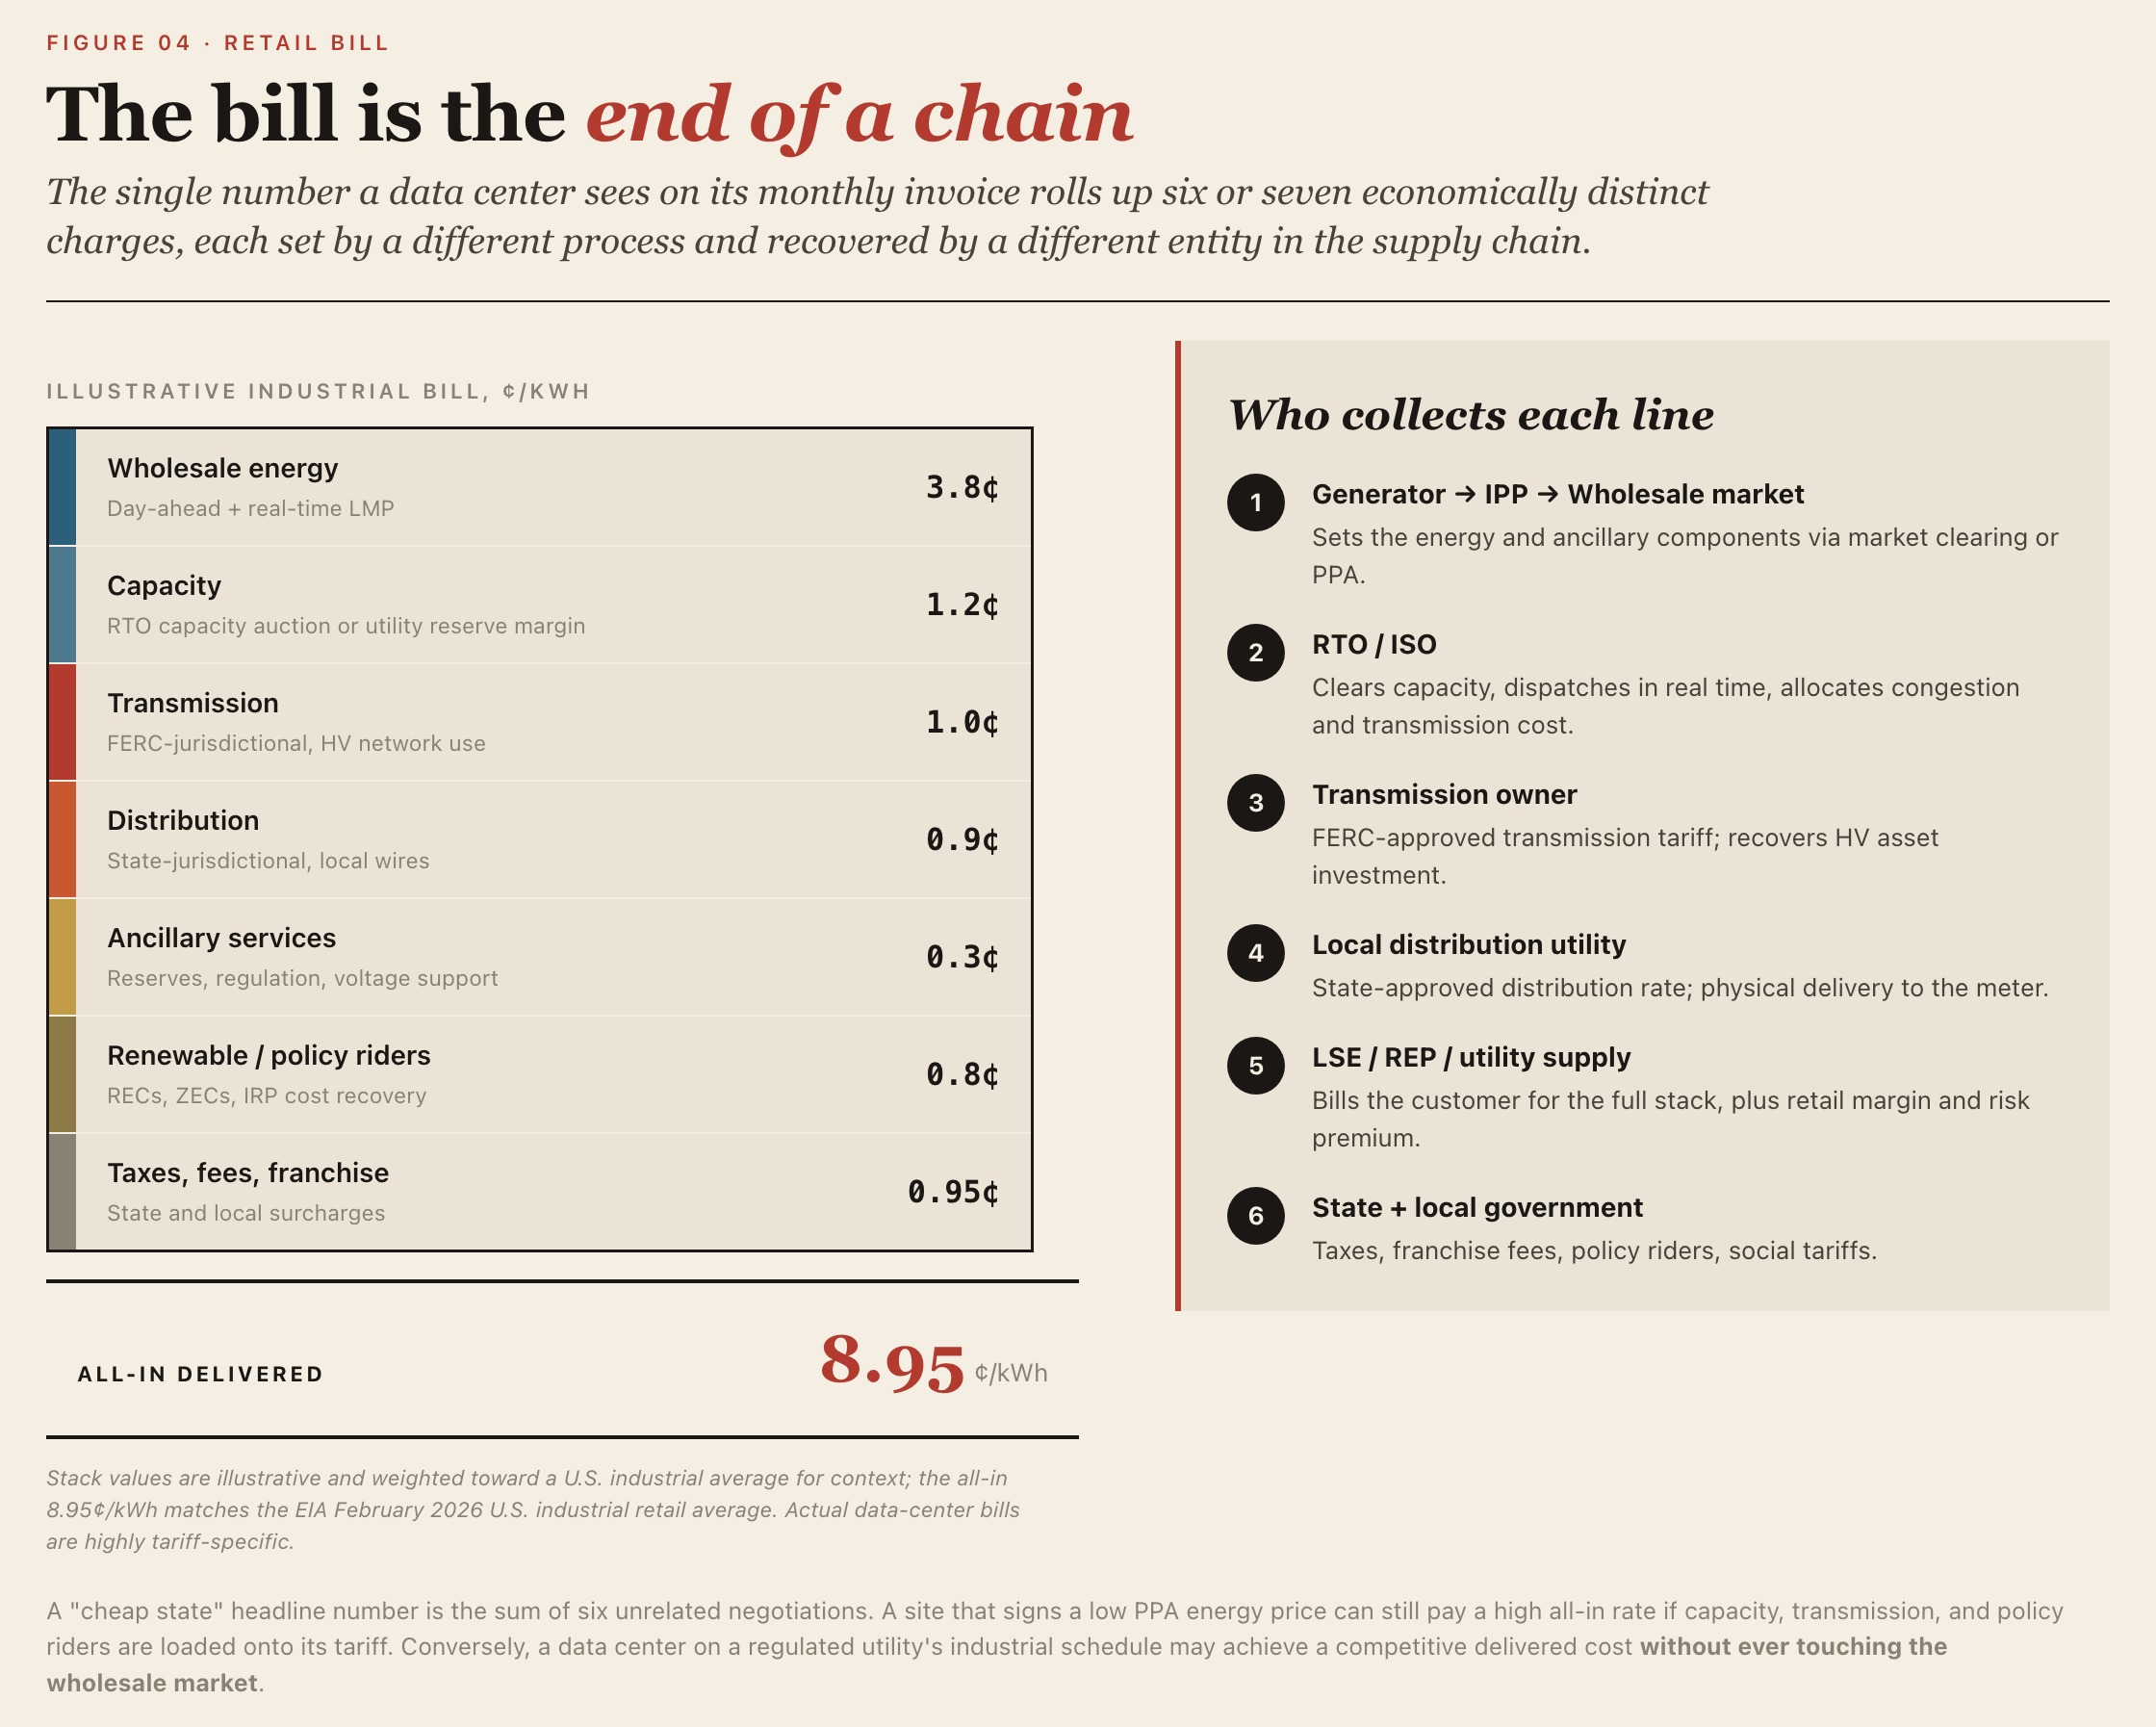
The electric bill a data center sees is only the end commercial outcome. Behind it lie multiple cost components: wholesale energy, capacity, transmission, distribution, ancillary services, taxes and fees, renewable energy credits, and recovery of local utility investment.
U.S. power markets generally fall into two commercial models: traditionally regulated markets and restructured competitive markets.
In a traditionally regulated market, a vertically integrated utility typically handles most of the value chain:
Generation / procurement → Transmission → Distribution → Retail sales → Customer billing
Rates are approved by the state PUC/PSC on a cost-plus-reasonable-return basis. Customers generally cannot choose their retail supplier, and the utility has a service obligation to all customers in its designated territory.
Examples include much of the U.S. Southeast, parts of the West, parts of the Northwest, and many cooperative and municipal territories. Georgia Power, Duke Energy, Southern Company, Entergy, SWEPCO, TVA, and many electric cooperatives all operate under this model.
For a data center, this model means the project team must negotiate directly with the local utility on interconnection capacity, service timing, rate class, dedicated lines, substation upgrades, and cost allocation. The utility's service commitment and the state regulator's approval timeline become the core constraints on project delivery.
In a restructured competitive market, the generation, transmission/distribution, and retail functions are unbundled to varying degrees. A typical structure looks like:
IPP / generator → RTO/ISO wholesale market → Distribution company delivery → REP/LSE retail → Customer
Under this model, generation competes in the wholesale market; the local distribution company handles physical delivery; and retail providers or LSEs sign supply contracts with customers. Customers may choose among different retailers, fixed-price or indexed contracts, green-power products, or financial hedging structures.
Typical markets include ERCOT, parts of PJM, NYISO, ISO-NE, and several Mid-Atlantic and Midwest states.
For a data center, this model means the project team must focus not only on whether the local distribution company can interconnect, but also on wholesale prices, capacity charges, congestion costs, retail contract design, and hedging strategy.
Two layers, two independent reforms. The presence of an RTO/ISO restructured wholesale dispatch; "deregulated retail" restructured the meter. A site can sit inside one without the other — and most often does. Confusing the two is the most common mistake in site screening:

Regulatory Authority: Federal, State, and Local
The U.S. power regulatory system features a clear federal-state separation of powers. In short:
| Level | Primary agency | Jurisdiction |
|---|---|---|
| Federal | FERC | Interstate transmission, wholesale markets, RTO/ISO tariffs, certain interconnection rules |
| Reliability | NERC | Develops and enforces bulk-power reliability standards, subject to FERC approval |
| State | State PUC / PSC | Retail rates, distribution service, utility cost recovery, service obligation, resource planning |
| Local | City / County | Land use, building permits, noise, water, environmental protection, fire safety, tax incentives |
FERC has jurisdiction over wholesale rates, interstate transmission, and RTO tariffs (but not ERCOT, which is intrastate). NERC sets and enforces mandatory bulk-power reliability standards through regional entities. State PUCs approve retail rates, integrated resource plans, and certificates of public convenience and necessity for new generation and transmission. Utilities can be vertically integrated (Southern, Duke, Dominion) or wires-only in deregulated markets.
Power Cost Comparison
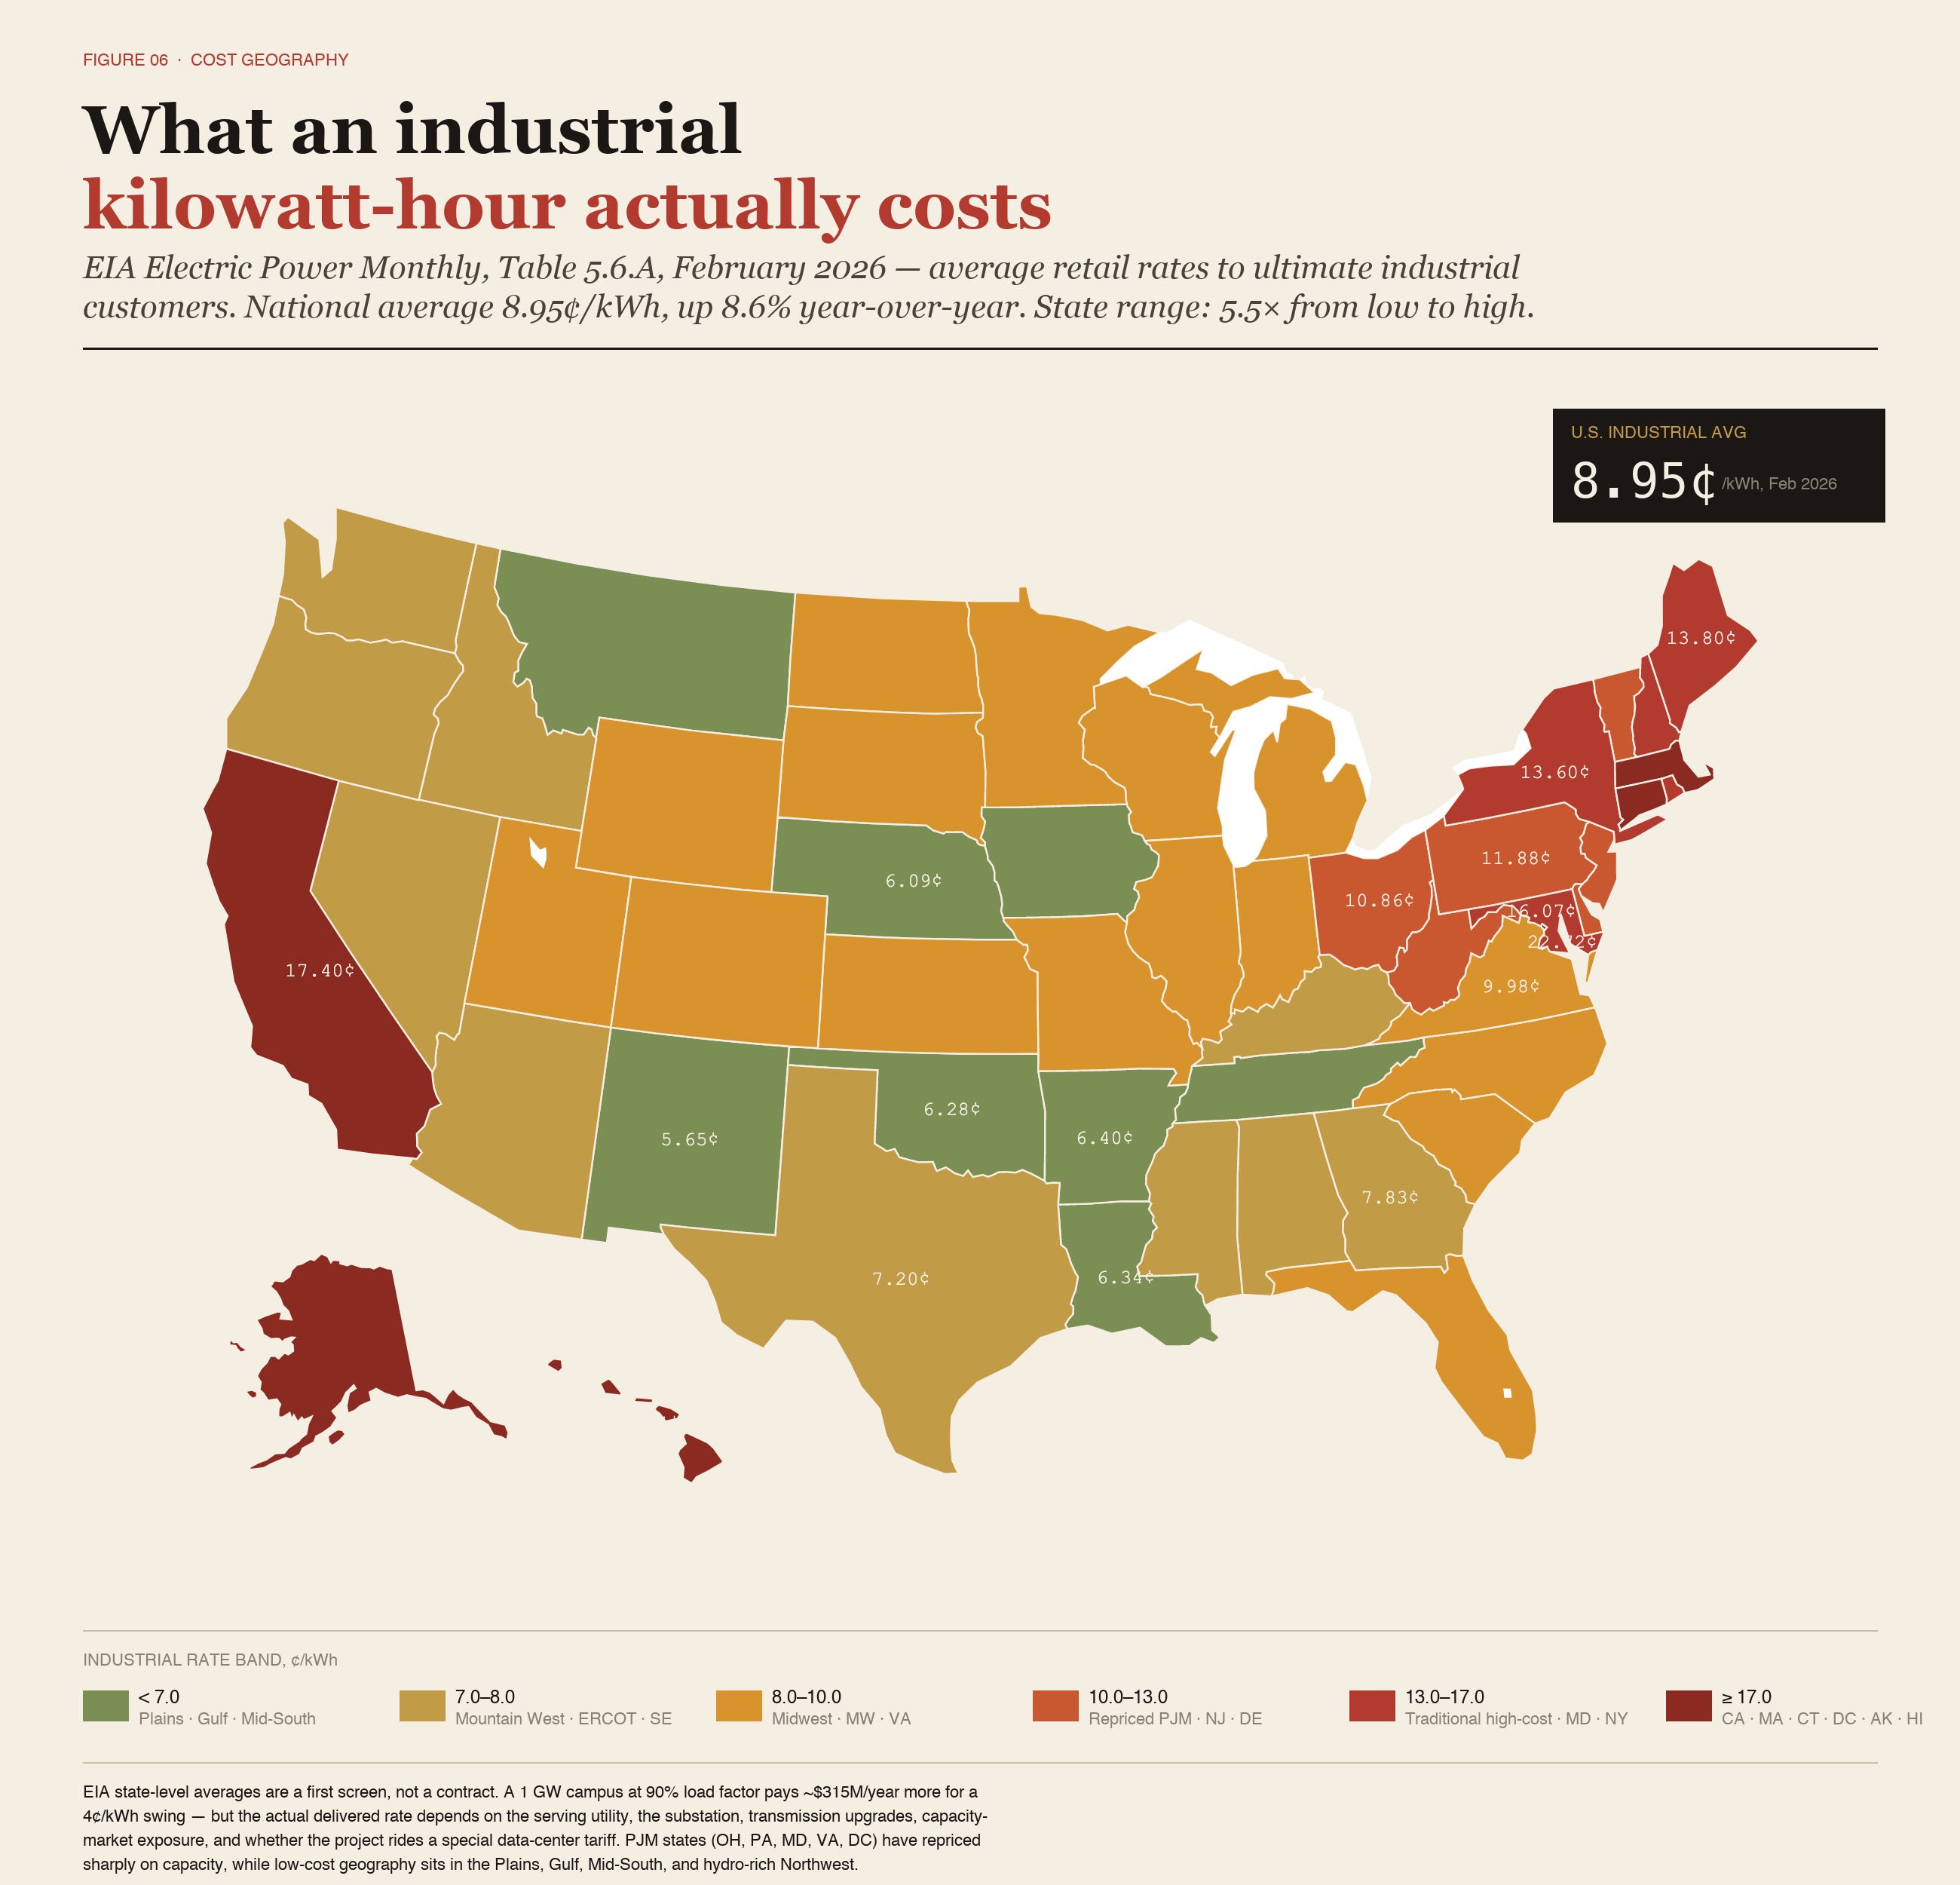
According to the U.S. Energy Information Administration's Electric Power Monthly, Table 5.6.A, released April 23, 2026, the average U.S. industrial retail electricity price was 8.95¢/kWh in February 2026, up roughly 8.6% year-over-year. This is an average retail price to ultimate customers, not a wholesale market-clearing price or a data-center-specific tariff. State-level prices ranged from Nebraska at 6.09¢/kWh to Hawaii at 33.24¢/kWh — a roughly 5.5× spread.
Band 1: Sub-7¢ Industrial Retail States
Eight states had average industrial retail prices below 7¢/kWh in February 2026:
| State | Industrial price, Feb. 2026 |
|---|---|
| New Mexico | 5.65¢/kWh |
| Nebraska | 6.09¢/kWh |
| Oklahoma | 6.28¢/kWh |
| Iowa | 6.33¢/kWh |
| Louisiana | 6.34¢/kWh |
| Arkansas | 6.40¢/kWh |
| Tennessee | 6.80¢/kWh |
| Montana | 6.90¢/kWh |
These states are concentrated in the Plains, the Gulf Coast, parts of the Mid-South, and hydro/wind/gas-rich regions. Their lower average industrial rates generally reflect some combination of abundant local generation, regulated utility structures, lower congestion exposure, legacy low-cost resources, and favorable fuel or renewable-resource positions. Project-level economics may still depend heavily on the serving utility, the nearest substation, transmission availability, and whether the project requires network upgrades.
Band 2: The 7–8¢ Regulated South, Mountain West, and Selected Low-Cost Markets
Ten states sat between 7.0¢ and 8.0¢/kWh:
| State | Industrial price, Feb. 2026 |
|---|---|
| Arizona | 7.07¢/kWh |
| Idaho | 7.17¢/kWh |
| Washington | 7.18¢/kWh |
| Texas | 7.20¢/kWh |
| Alabama | 7.50¢/kWh |
| Nevada | 7.51¢/kWh |
| Mississippi | 7.54¢/kWh |
| Kentucky | 7.64¢/kWh |
| Georgia | 7.83¢/kWh |
| Oregon | 7.94¢/kWh |
This band includes a mix of regulated utility territories, hydro-rich states, Mountain West utilities, Southeastern regulated markets, and ERCOT/Texas. It is attractive for data-center screening because many of these markets combine moderate industrial power prices with relatively strong land availability and, in some cases, faster development pathways than the most constrained PJM markets. That said, statewide averages are especially limited in this band: a Texas ERCOT site, a Georgia Power site, an SRP/APS Arizona site, and a BPA/PUD-served Washington site all face very different commercial and regulatory structures.
Band 3: The 8–10¢ Middle
A large portion of the country sits between 8¢ and 10¢/kWh. The group includes, among others, North Dakota, South Dakota, Utah, Michigan, Wyoming, Wisconsin, Minnesota, Colorado, Florida, Indiana, Illinois, and Virginia. It also includes several markets where data-center growth, utility capital spending, transmission constraints, or regional capacity costs are beginning to show up more clearly in retail rates.
Virginia is particularly important for data-center analysis. Its February 2026 industrial price of 9.98¢/kWh sits just below the 10¢ threshold, but Northern Virginia's actual data-center economics are more exposed to PJM capacity costs, local transmission upgrades, Dominion service constraints, and utility-specific rate design than the statewide average alone suggests.
Band 4: 10¢+ Industrial Retail Markets
The 10¢+ band contains two different groups that should not be conflated.
The first group consists of traditionally high-cost states — parts of New England, New York, California, Alaska, and Hawaii. These markets are structurally expensive because of fuel costs, policy costs, infrastructure costs, geography, or legacy rate structures.
The second group consists of several PJM states that saw sharp year-over-year increases, including Ohio, Pennsylvania, Maryland, Virginia, and DC. Ohio rose from 7.94¢/kWh to 10.86¢/kWh, Pennsylvania from 9.14¢/kWh to 11.88¢/kWh, Maryland from 11.10¢/kWh to 16.07¢/kWh, and DC from 5.84¢/kWh to 22.72¢/kWh. These movements are consistent with PJM's broader capacity-market repricing, although DC's industrial rate jump should be treated cautiously because small industrial customer bases and classification changes can distort month-to-month or year-over-year comparisons.
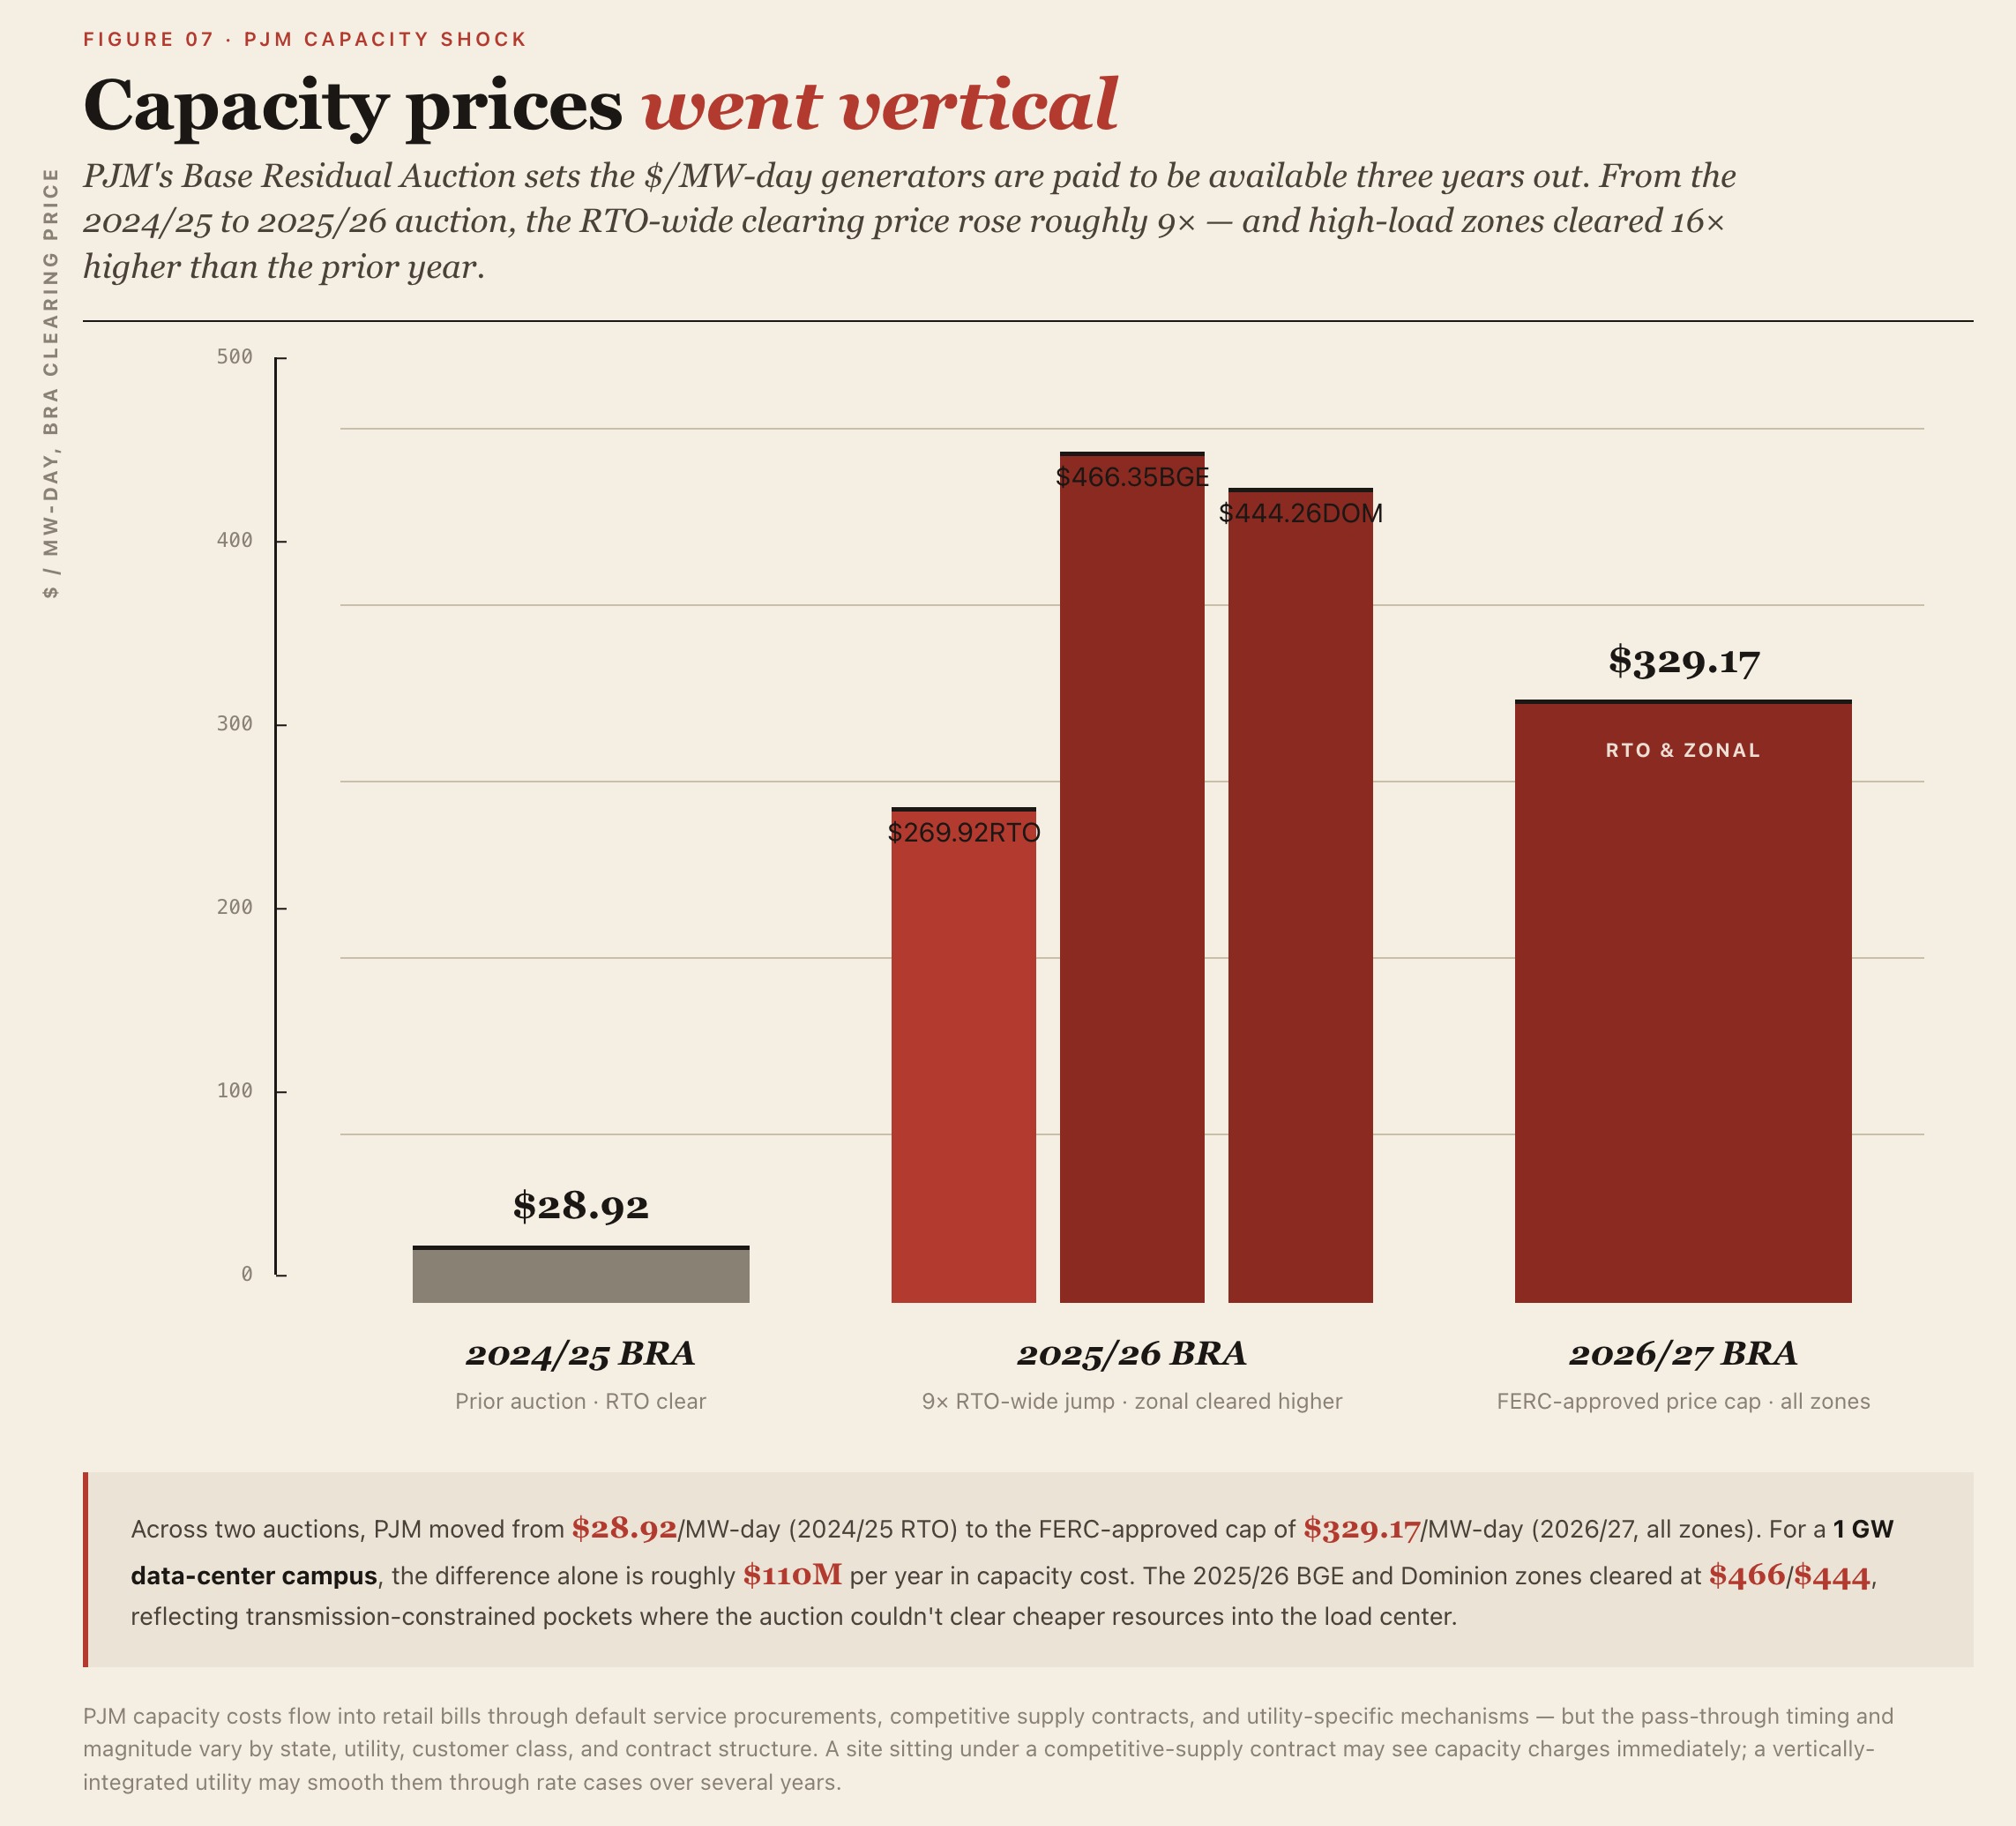
PJM's capacity-market shock is material. The 2025/2026 Base Residual Auction cleared at $269.92/MW-day for the RTO, compared with $28.92/MW-day in the prior auction, while the BGE and Dominion zones cleared at $466.35/MW-day and $444.26/MW-day, respectively. The 2026/2027 auction then cleared at the FERC-approved cap of $329.17/MW-day across the PJM footprint. These capacity prices can flow through to customers via retail supply rates, default service procurements, competitive supply contracts, or utility-specific mechanisms, but the pass-through timing and magnitude vary by state, utility, customer class, and contract structure.
What the Geography Means for Data-Center Siting
The February 2026 data support a clear siting thesis: the cheapest industrial power remains concentrated in parts of the Plains, the Gulf Coast, the Mid-South, and the hydro-rich Northwest, while several PJM states have repriced materially upward. The conclusion, however, should not be that "cheap state equals cheap data-center power." A hyperscale campus does not buy electricity at a generic statewide industrial average. It buys power through a specific utility tariff, special contract, PPA, retail supply arrangement, behind-the-meter generation strategy, or hybrid portfolio.
For a 1 GW AI training campus running at a 90% load factor, a 4¢/kWh difference in delivered electricity cost equals approximately $315 million per year in operating cost:
1,000 MW × 8,760 hours × 90% = 7.884 billion kWh/year
7.884 billion kWh × $0.04/kWh ≈ $315 million/year
That cost sensitivity explains why hyperscalers and AI infrastructure developers are increasingly evaluating lower-cost, power-advantaged regions such as Texas, Louisiana, Georgia, Iowa, Wyoming, Arizona, and the Pacific Northwest. But the relevant diligence question is site-specific: which utility serves the parcel, which substation can deliver the load, what upgrades are required, how long will interconnection take, and what all-in delivered cost will apply under the actual commercial structure?
In short, EIA state-level industrial prices are a useful first screen, but no substitute for utility-specific tariffs, transmission studies, substation capacity analysis, capacity-market exposure, and project-level power procurement diligence.
Grid Reliability Comparison
Traditional industrial loads such as steel mills or auto plants are largely inductive and exhibit slow ramp rates. Hyperscale data centers, however, introduce unique technical challenges beyond raw demand: their advanced power-electronic converters and uninterruptible power supplies (UPS) interact with the grid in ways that are highly sensitive to short-duration disturbances. Reliability regulators, including the North American Electric Reliability Corporation (NERC), have designated data centers as a class of "large loads" whose operating characteristics can destabilize the bulk power system.
NERC sets and enforces mandatory reliability standards for the Bulk Electric System (BES, generally transmission ≥100 kV and generation ≥75 MVA), under FERC oversight. Six regional entities — ReliabilityFirst (RF, covering the Mid-Atlantic and Ohio Valley), SERC Reliability Corporation (Southeast), WECC (Western Interconnection), Texas RE (ERCOT), MRO (Upper Midwest), and NPCC (Northeastern U.S. and Eastern Canada) — handle monitoring and compliance enforcement.
NERC Resource Risk Assessment
NERC released its assessment on January 29, 2026 (based on mid-2025 data, covering 2026–2035). The headline finding: "13 of the 23 assessment areas in North America face elevated or high resource-adequacy risk over the next five years." High-risk areas (red) include MISO, PJM, Texas RE-ERCOT, WECC-Northwest, WECC-Basin, and SERC-Central. Elevated-risk areas (orange) include SPP, NPCC-New England, NPCC-New York, SERC-East, CA/MX, and MRO-Manitoba Hydro. NERC's John Moura summarized: "This assessment is not a forecast of system failure, but an early warning of the risk trajectory… The path forward remains manageable, but only if the resources currently planned come online on schedule."
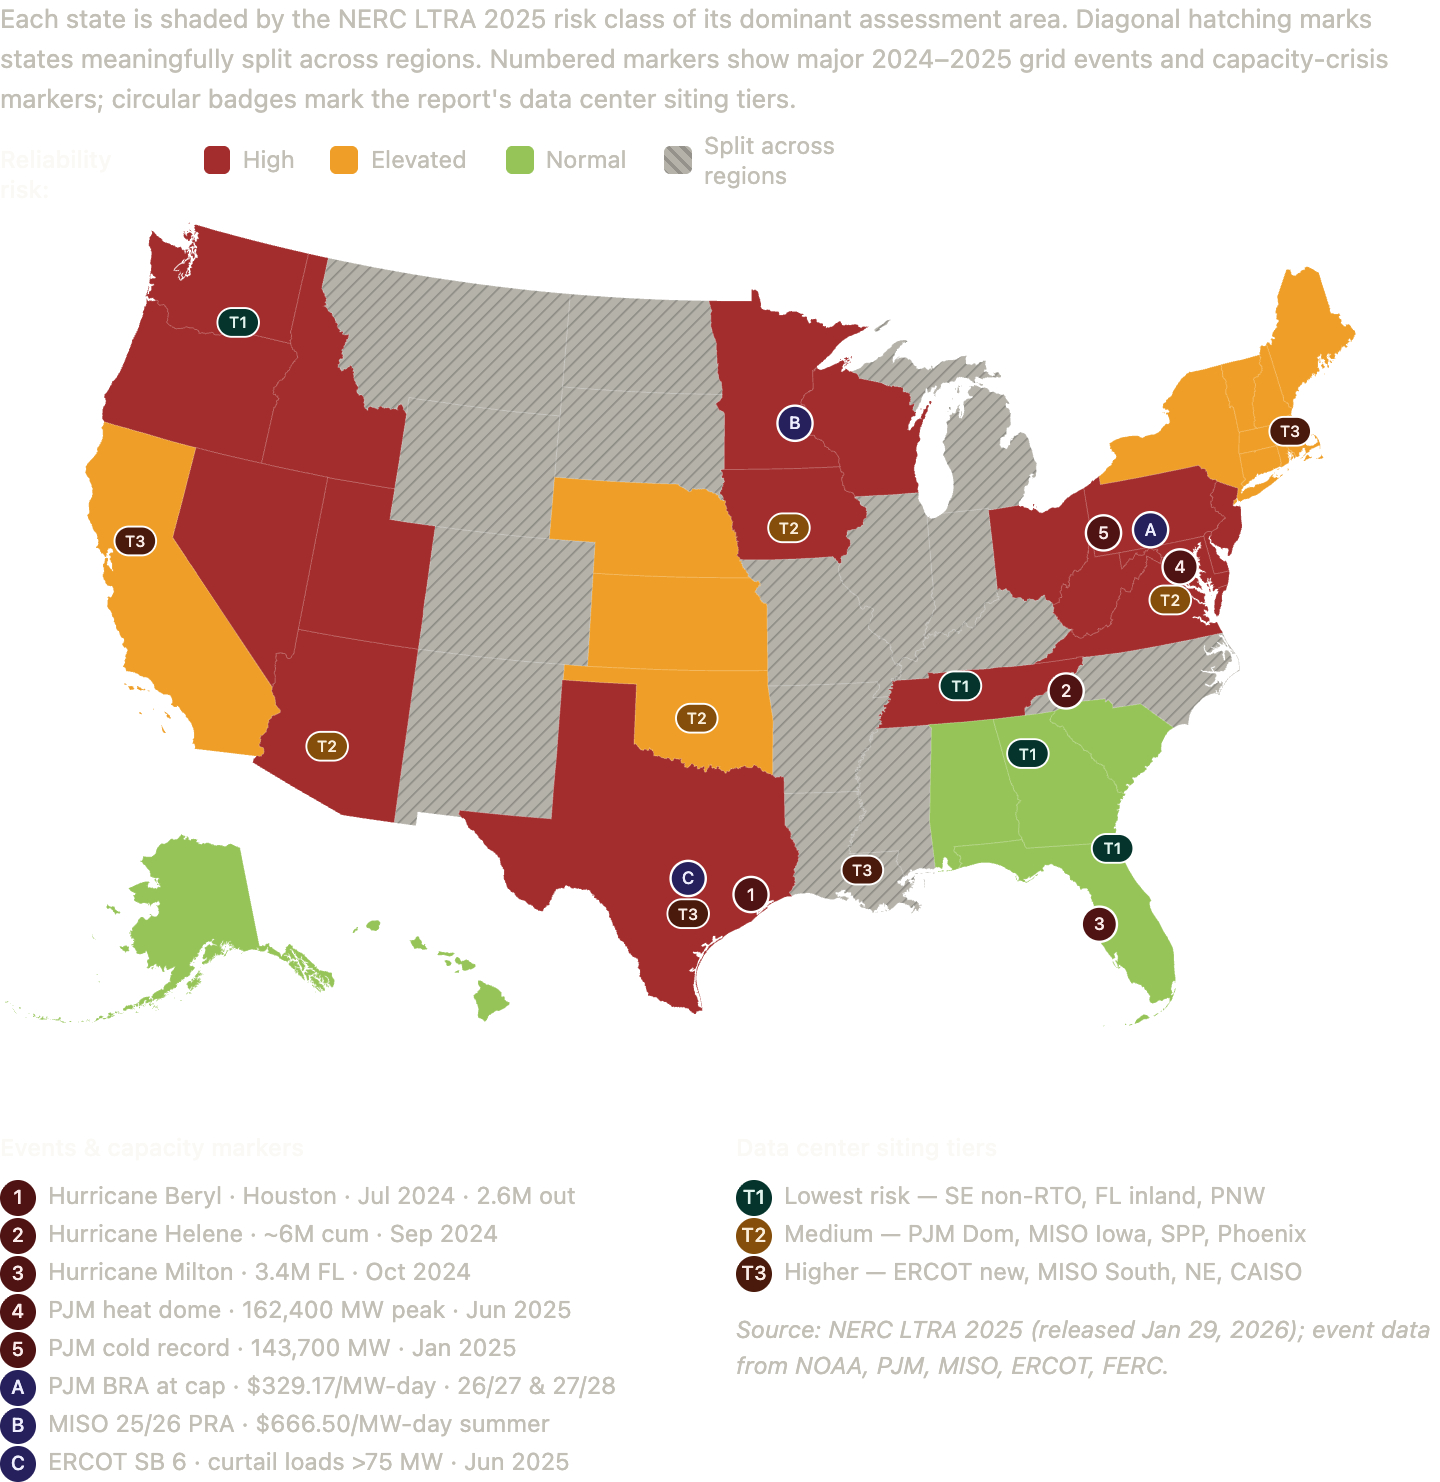
The base layer follows the NERC LTRA 2025 risk classifications, mapped to states via each state's primary assessment area. Red denotes high risk (MISO, PJM, ERCOT, WECC-Basin, WECC-Northwest, SERC-Central). Yellow denotes elevated risk (SPP, New England, New York, SERC-East, CA/MX). Green marks the relatively normal Southeast non-RTO core and the deep Pacific Northwest hydro base. Gray diagonal hatching marks states that truly span multiple regions — Arkansas, Missouri, Louisiana, Mississippi, the Dakotas, Wyoming, Colorado, New Mexico, Montana, Kentucky, Illinois, Indiana, Michigan, and North Carolina — where a single color label would be misleading.
Overlay markers: dark-red numbered circles (1–5) flag 2024–2025 extreme weather and grid stress events. Dark-purple lettered circles (A–C) flag capacity crises — PJM at its price cap, MISO's $666.50/MW-day summer auction, and Texas SB 6. Pill-shaped badges (T1–T3) plot the siting tiers from the strategic-recommendations section of the reliability report, placed at representative geographies.
Tier 1 (lowest-risk) badges sit almost entirely on green or normal-colored base regions — the Southeast non-RTO corridor, Florida, and the Pacific Northwest hydro core. Tier 3 (highest-risk) markers align with red or hatched regions and cluster with event markers — ERCOT (C and 1), southern MISO (B and 2), and New England (the elevated amber band). The visual confirms the report's thesis: siting should follow green and avoid red. The hatched-state column (from Arkansas to Wyoming) is the most interesting frontier — siting decisions in those states depend on which utility footprint a campus lands in.
One caveat the map cannot show. Risk is a forward distribution, not a point. Tennessee is colored red because SERC-Central was flagged high-risk by NERC in January 2026 — but TVA is one of the better-prepared utilities in the country, and its risk is driven by load growth rather than fleet weakness. The PJM Dominion zone in Virginia is the inverse: red because PJM is in a capacity crisis, but with dense transmission and strong distribution. The composite map is a starting point for siting analysis, not a substitute for it.
Customer-Experience Reliability State-by-State
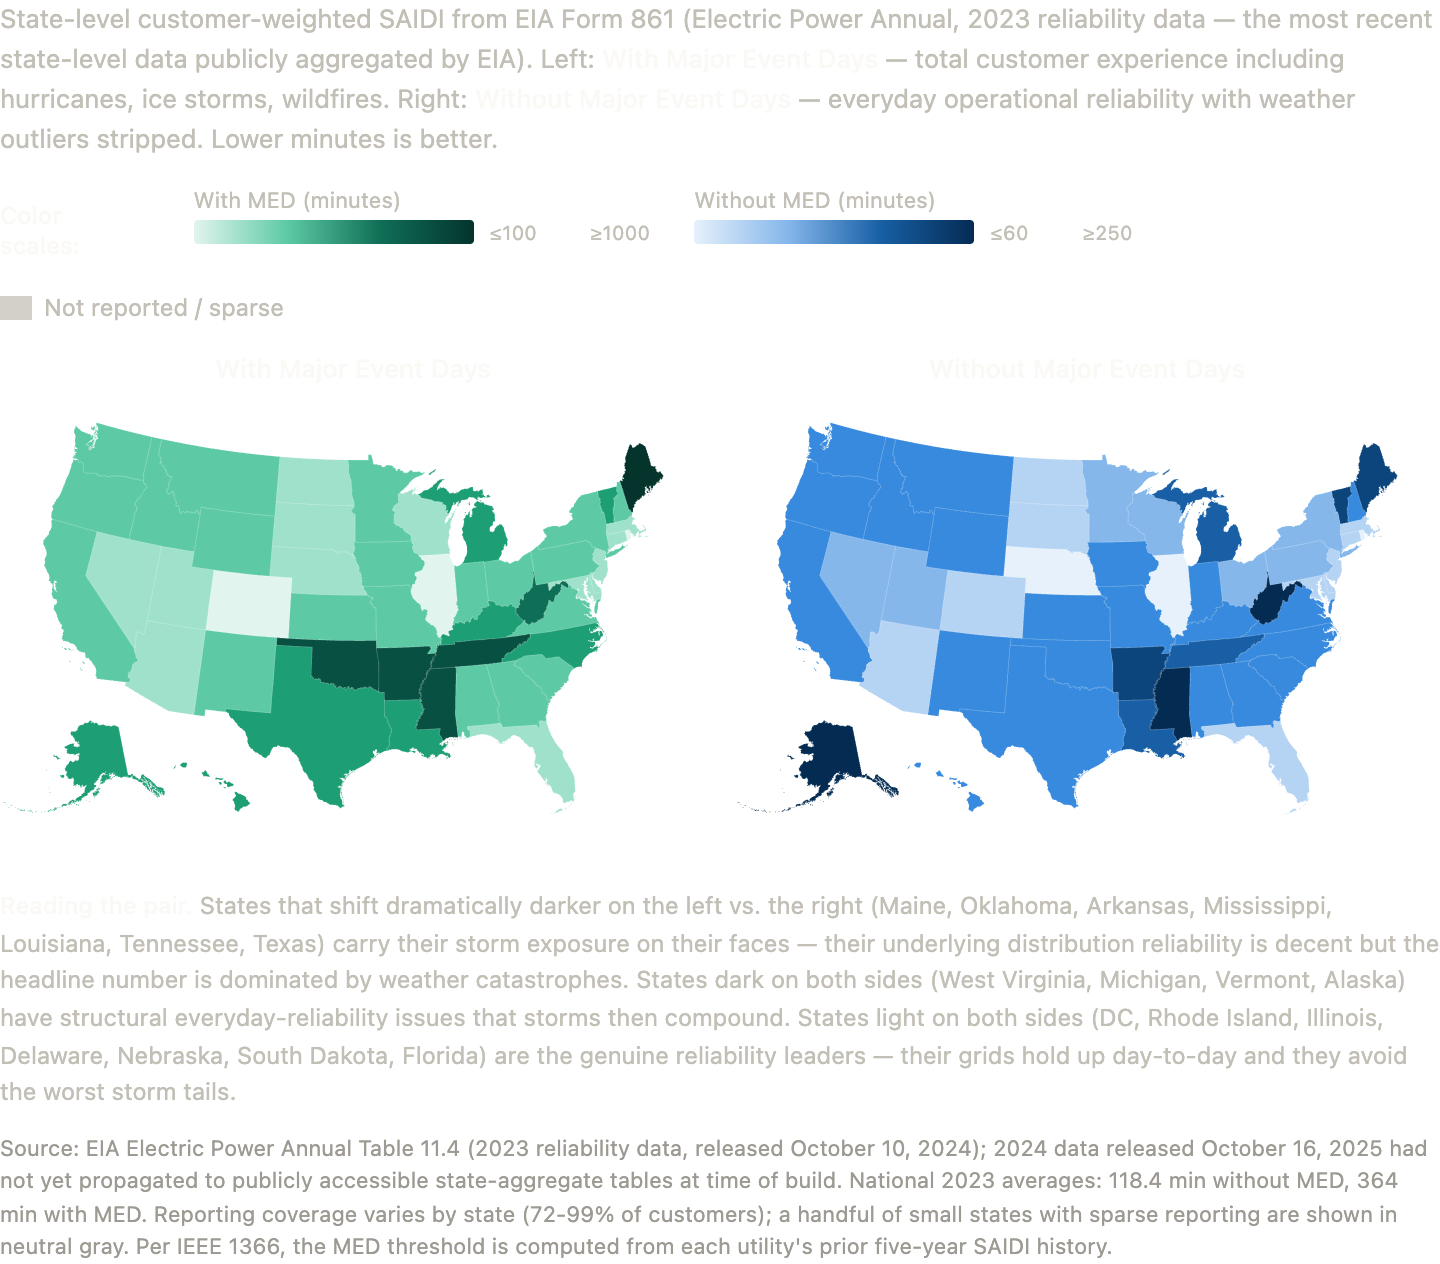
The left panel is the storm-tail map; for a hyperscale campus whose generation contracts include force-majeure clauses, this is what determines how often the campus needs to operate behind-the-meter for multi-day stretches. The right panel is the everyday-grid-quality map; this is what determines how often a transient grid event will momentarily trip onto UPS and force a re-spin of training jobs. Florida looks essentially identical to Arizona on the right (~69 minutes) — but storm-exposed Florida is three times worse on the left. Texas is near the national median on the right (125 minutes) but darkens significantly on the left due to the residual statistical weight of Winter Storm Uri in the 2019–2023 baseline. The pattern that matters most: the green/light-blue states that look light on both panels (DC, Rhode Island, Illinois, Delaware, Florida-everyday, Nebraska, Arizona) are the genuine year-round reliability leaders. Many of these — Illinois, Delaware, Arizona — also happen to be in or adjacent to active data-center buildout corridors.
The MED-inclusion choice fundamentally changes which states look "bad." Maine on the left is the darkest state on either map (1,863 minutes of customer-experienced outage in 2023, dominated by one severe storm event) — but on the right Maine is mid-pack at 247 minutes, meaning its everyday distribution operations are merely below-average, not catastrophic. The opposite case is West Virginia: dark on both panels (752 minutes with MED, 386 without). That is the state with the worst underlying distribution reliability in the country — terrain, vegetation, aging infrastructure, and cooperative-heavy service territories all working against it.
Power Supply Strategies
Delivery Models
Utility Tariff Service
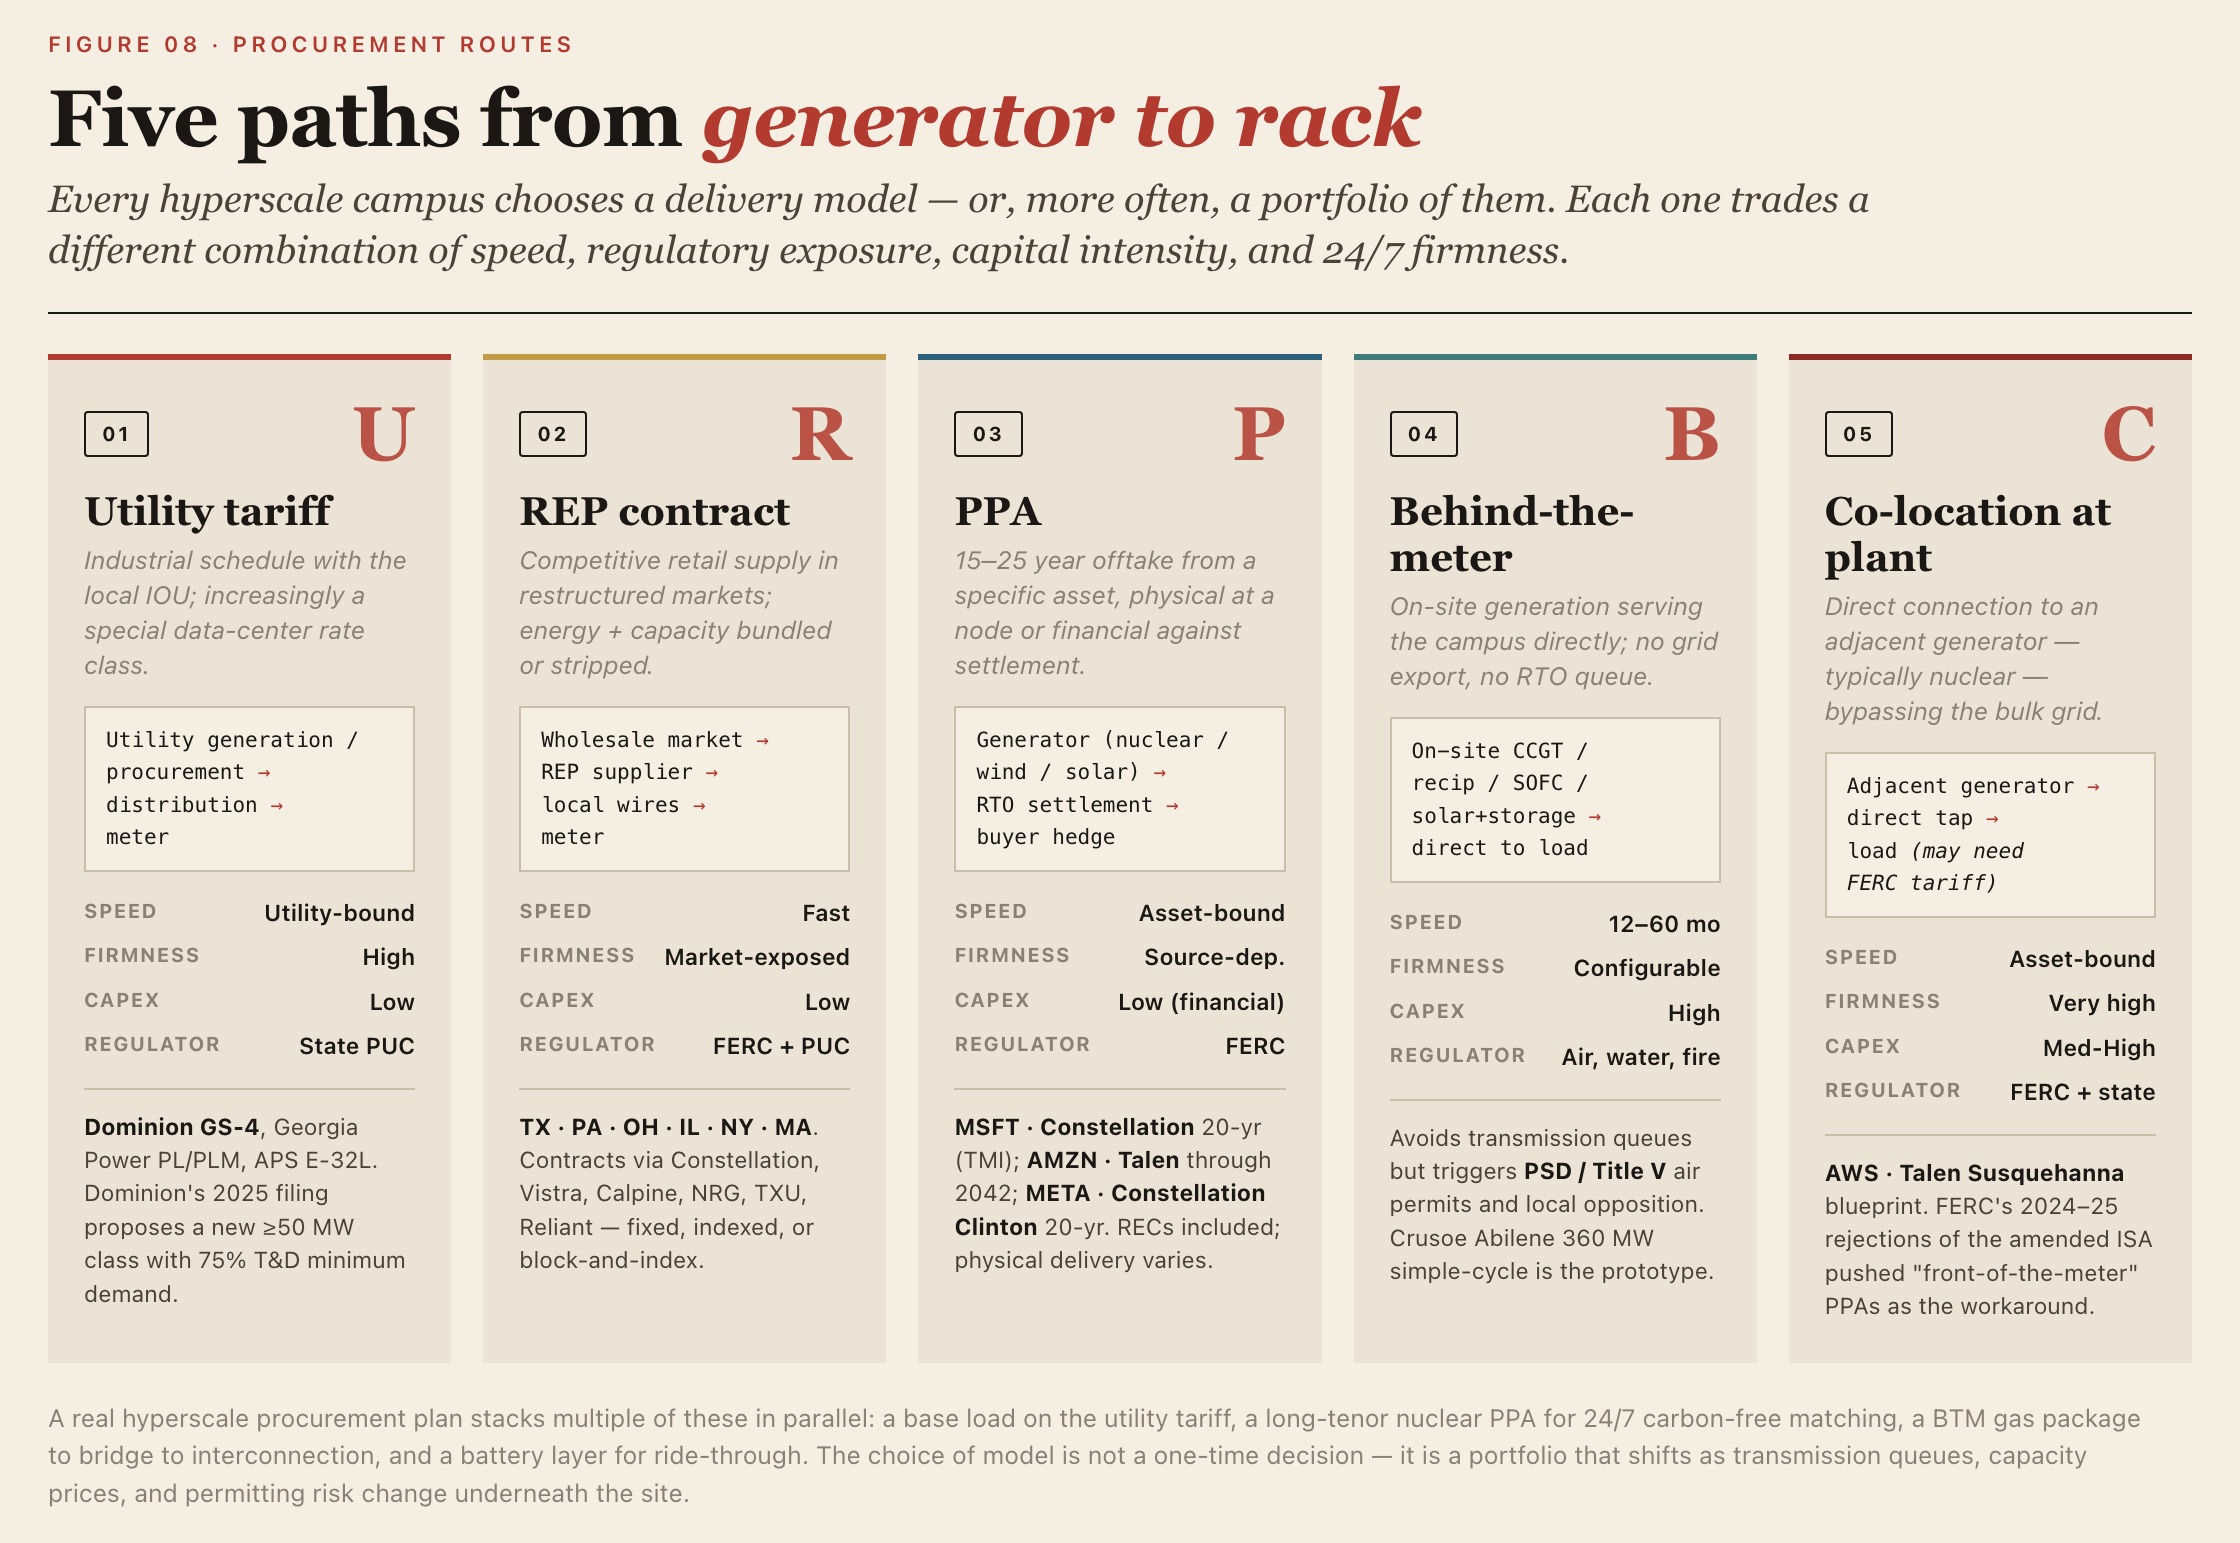
Standard industrial / large-power rates (e.g., Dominion Schedule GS-4, Georgia Power Schedule PL/PLM, APS E-32L). The simplest path, but utilities are now creating dedicated rate classes for data centers: Dominion's September 2025 filing proposes a new ≥50 MW class with a 75% transmission/distribution minimum demand obligation and a 50% generation minimum obligation for non-shopping customers. AEP Ohio similarly secured PUCO-approved rules requiring minimum-purchase contracts.
Retail Electric Provider (REP) Contracts
Available in Texas, Pennsylvania, Ohio, Illinois, and parts of New York and Massachusetts. The data center contracts directly with a competitive supplier (Constellation, Vistra, Calpine, NRG, TXU, Reliant) on fixed-price, indexed, or block-and-index terms. Capacity charges still pass through.
Power Purchase Agreements (PPAs)
- Physical PPA: customer takes delivery at a specific node and settles imbalances with the ISO.
- Virtual / financial PPA (VPPA): contract-for-differences against a node settlement price; customer receives RECs but no physical energy.
- Long-tenor (15–25 year) PPAs have become standard for hyperscaler nuclear and renewables (Microsoft-Constellation: 20 yrs; Amazon-Talen: through 2042; Meta-Constellation Clinton: 20 yrs).
Behind-the-Meter (BTM) Generation
On-site gas turbines, reciprocating engines, fuel cells, or solar+storage that serve the load directly and are not connected to the grid for export. Avoids transmission queues but requires air permits (PSD, Title V) and may face local opposition.
Co-Location at a Power Plant
Direct connection to an adjacent generator (e.g., Talen-AWS at Susquehanna). After FERC's November 2024 / April 2025 rejections of the Talen amended ISA, "behind-the-meter" co-location at existing nuclear without grid backup faces regulatory headwinds; "front-of-the-meter" PPAs at the same site are the workaround.
Compliance and Financial Strategies
RECs and Carbon Accounting
Unbundled RECs (~$1–5/MWh) are losing favor; 24/7 carbon-free-energy (CFE) matching — Google's standard, and increasingly Microsoft's and Meta's — requires hourly or sub-hourly matching of consumption with carbon-free generation at the same grid node.
Tax Credits Under the IRA (as of May 2026)
- ITC (48E) and PTC (45Y): technology-neutral; renewables and storage; partially phased down for projects starting after 2025 under recent law changes.
- 45Q: $85/ton for sequestered CO₂ — key to Exxon's data-center play.
- 45V: clean hydrogen ($0.60–$3/kg sliding scale).
- 45U: $15/MWh production credit for existing nuclear (through 2032), critical to making restarts and uprates economic; Three Mile Island / Crane explicitly eligible.
- Section 48 ITC for advanced nuclear: 30%+ for new SMRs/AP1000s meeting prevailing-wage rules.
Demand Response and Grid Services
PJM's demand-response ELCC moved from 5,531 MW to 7,299 MW cleared between auctions; ERCOT's voluntary Large Load Demand Management Service (under SB 6) will pay ≥75 MW loads to curtail in advance of emergencies. EPRI/Duke (Tyler Norris) studies show flexible data-center loads could integrate hundreds of GW at lower cost, and Emerald AI's Phoenix demonstration with SRP showed dispatchable load flexibility.
Alternative Supply Options (BTM)
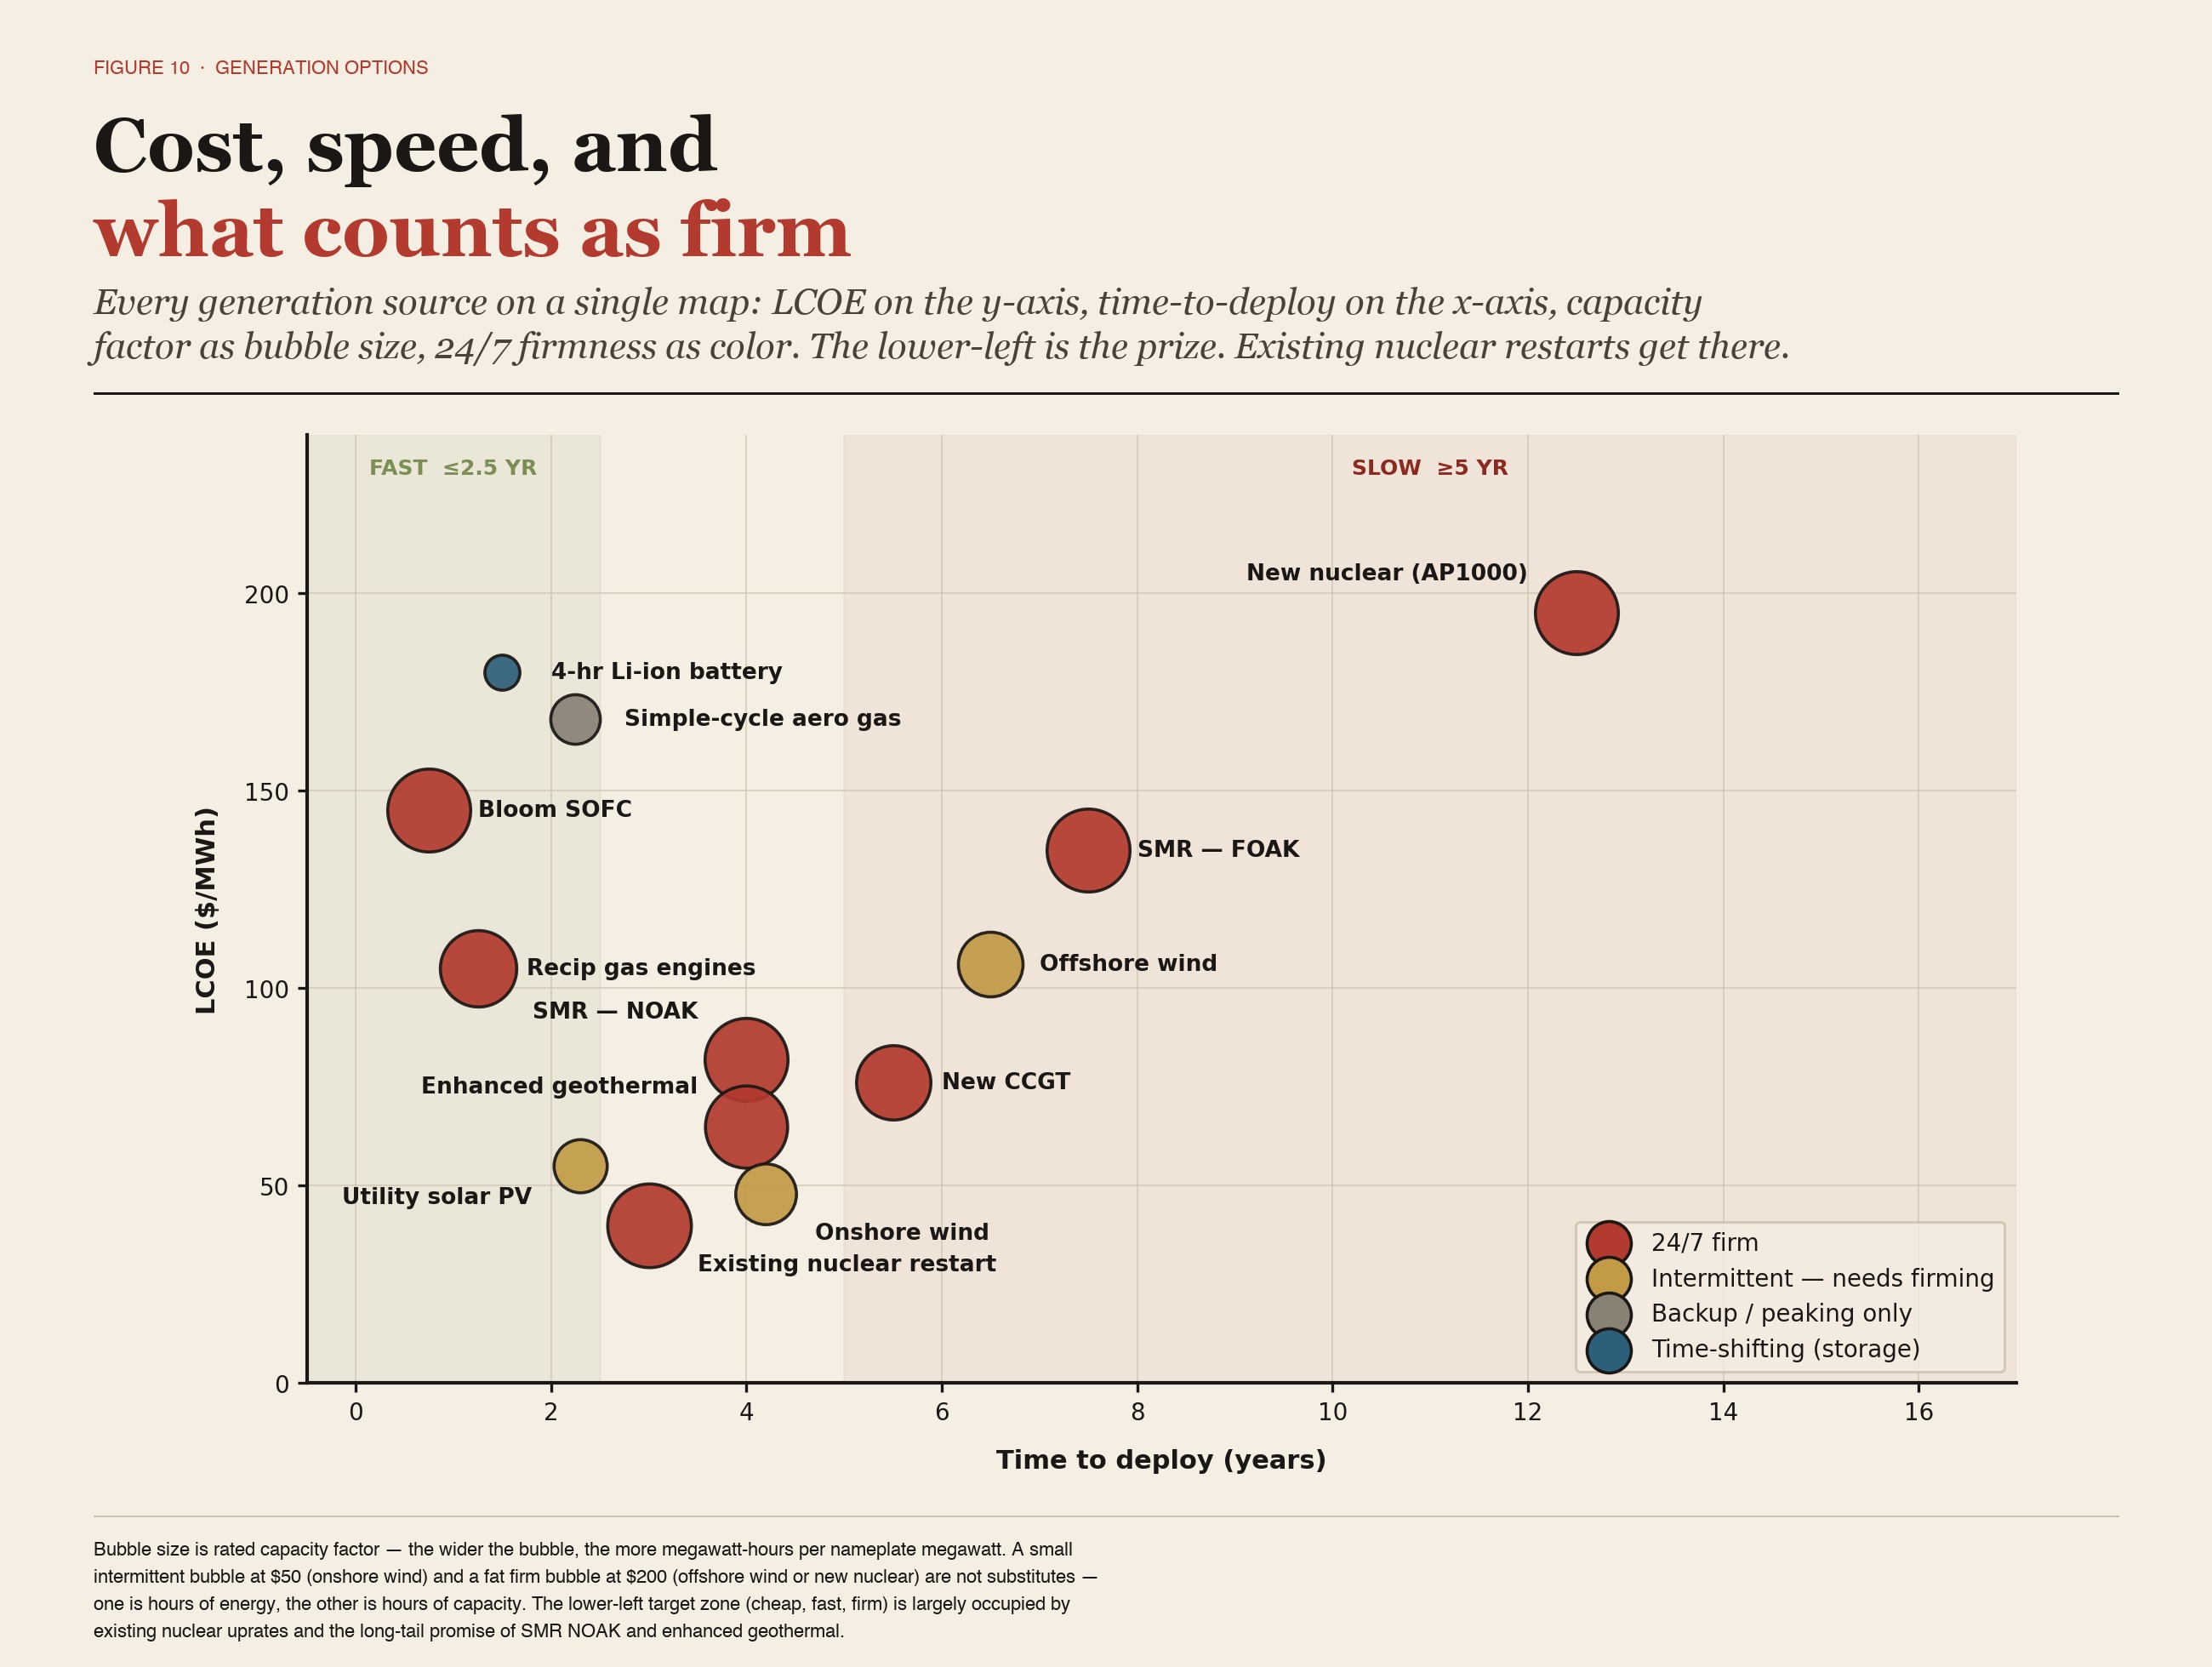
| Generation type | Capex ($/kW) | LCOE ($/MWh) | Capacity factor | Time to deploy | 24/7 suitability | kgCO₂/MWh |
|---|---|---|---|---|---|---|
| CCGT (new) | $2,150–$2,500 | $45–$108 | 55–85% | 4–6 yrs | Excellent | ~370 |
| Simple-cycle gas (aero) | $1,000–$1,500 | $115–$221 | 10–30% | 18–36 mo | Backup only | ~450 |
| Reciprocating gas engines | $1,200–$2,000 | $80–$130 | up to 90% | 12–18 mo | Excellent | ~480 |
| Bloom solid-oxide fuel cell | $3,000–$5,000 | $110–$180 | 90%+ | 6–9 mo | Excellent | ~280 → 0 (H₂) |
| New large nuclear (AP1000) | $10,000–$15,000+ | $170–$220 | 90%+ | 10–15 yrs | Excellent | ~12 |
| SMR (FOAK) | $5,000–$20,000 | $89–$180 | 90%+ | 5–10 yrs | Excellent | ~12 |
| SMR (NOAK) | $3,500–$5,000 | $60–$100 (target) | 90%+ | 3–5 yrs (post-2030) | Excellent | ~12 |
| Existing nuclear uprate / restart | $1,000–$3,000 | $30–$50 | 92–97% | 2–4 yrs | Excellent | ~12 |
| Utility-scale solar PV | $1,000–$1,400 | $29–$92 | 20–32% | 2–3 yrs | Poor alone | ~40 (LCA) |
| Onshore wind | $1,300–$1,800 | $27–$73 | 35–45% | 3–5 yrs | Poor alone | ~12 (LCA) |
| Offshore wind | $4,000–$6,000 | $74–$139 | 40–55% | 5–8 yrs | Moderate | ~13 |
| 4-hr Li-ion battery | $1,200–$1,800/kW | $124–$236 | n/a | 1–2 yrs | Time-shift only | ~0 |
| Enhanced geothermal | $4,000–$10,000 → $3,700 | $61–$102 → $45 | 85–95% | 3–5 yrs | Excellent | ~40 |
| Coal (legacy) | $4,000–$6,000 | $68–$166 | 50–80% | n/a (no new builds) | Excellent | ~900 |
- CAPEX answers: what is the upfront capital expenditure to build this generation source?
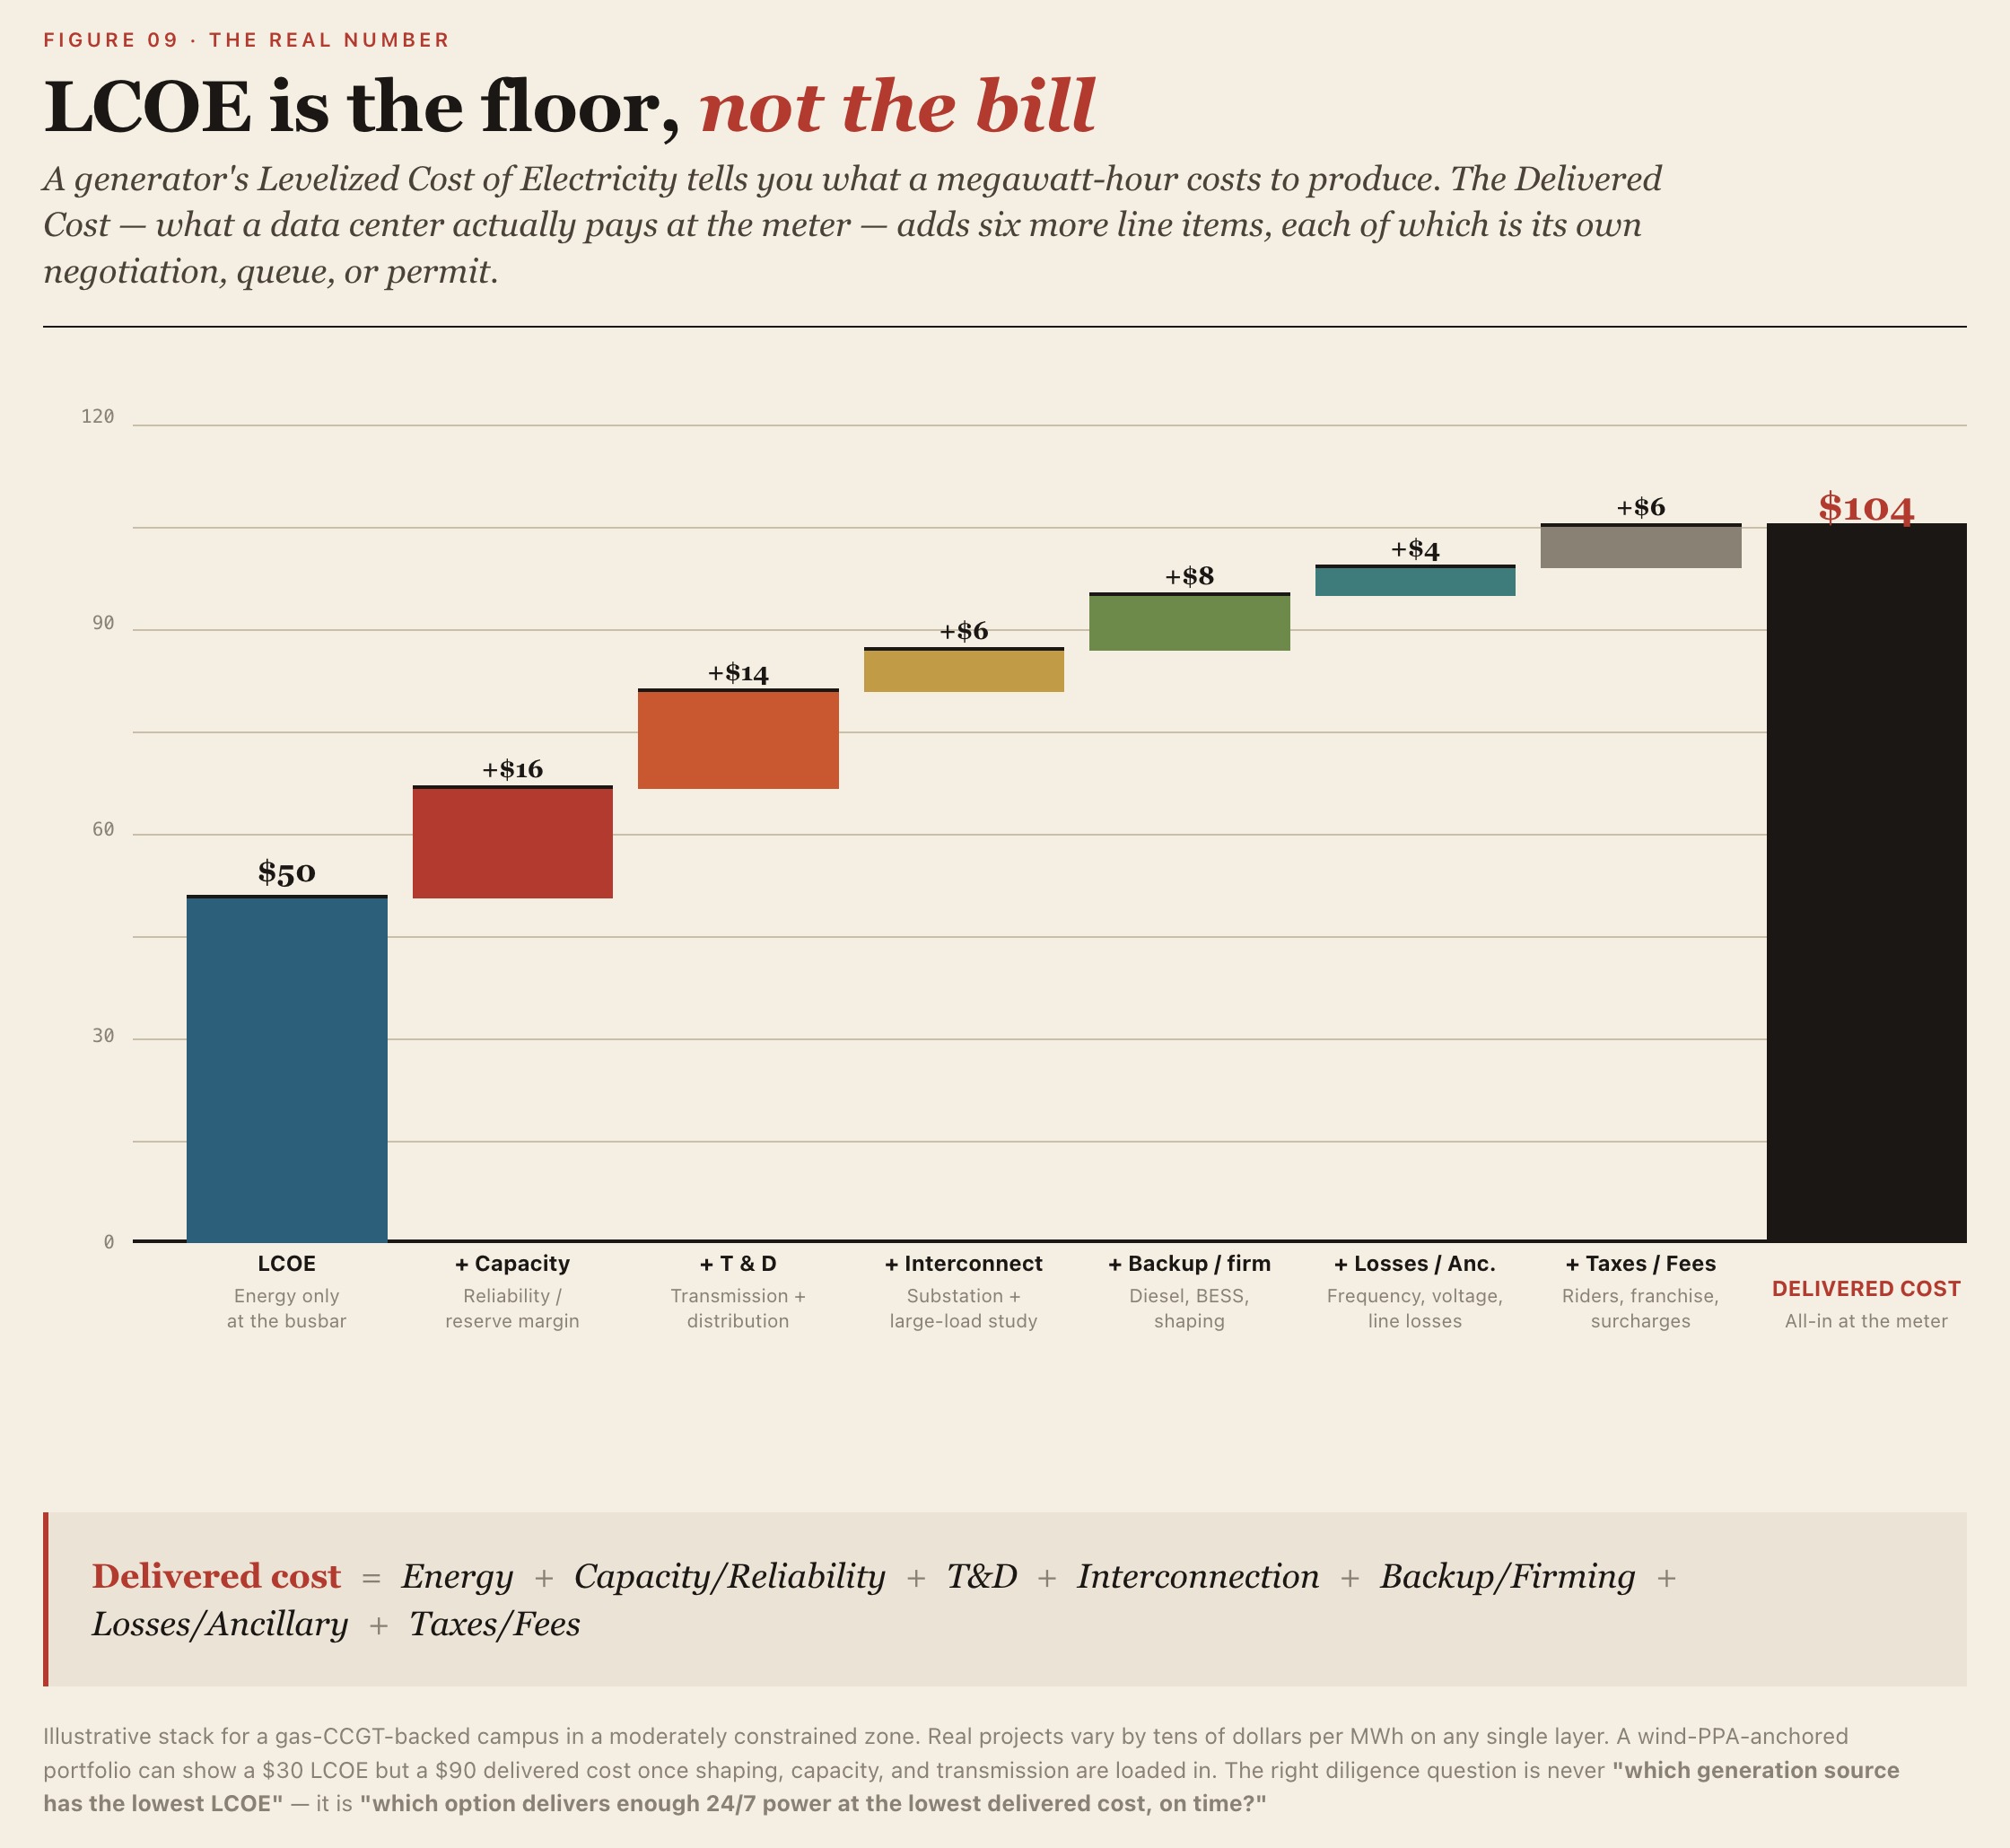
- LCOE — Levelized Cost of Electricity — can be understood as the long-run average cost per unit of electricity over a project's lifetime, after spreading capital expenditure, fuel, O&M, and financing costs across every MWh produced. The standard unit is $/MWh.
LCOE answers only "how much does the plant cost to generate." Delivered Cost goes further to include where the power comes from, how it is brought to the data center, whether it can supply 24/7, what engineering is required to interconnect, and every line item that ultimately appears on the bill:
Delivered Cost = Energy + Capacity/Reliability + T&D + Interconnection + Backup/Firming + Losses/Ancillary + Taxes/Fees
| Item | Meaning | Notes |
|---|---|---|
| Energy | Price of the electrons themselves | The base price, sourced from wholesale market prices, PPA prices, utility energy charges, or the LCOE of self-built generation. It answers "what does 1 MWh cost on its own?" LCOE ≈ Energy. |
| Capacity / Reliability | Cost of capacity and reliability | A data center needs not only enough energy across the year but enough power at every moment. A 100 MW campus needs a grid or generation system committed to 100 MW at all times. This appears as capacity charges, reliability fees, reserve-margin contributions, and capacity-market costs. |
| T&D | Transmission and distribution cost | The cost of the network that moves electricity from generation to the data center: high-voltage transmission, local distribution, substation use, line maintenance, and transmission congestion. A cheap PPA price does not mean cheap delivered power. |
| Interconnection | Connection cost | The engineering cost of connecting the data center to the grid or to a generation source: new or expanded substations, transformers, breakers, protection systems, transmission lines, large-load interconnection studies, and utility interconnection studies. Usually a one-time capex, often annualized into $/MWh. |
| Backup / Firming | Backup and firming cost | Backup is standby power for grid failures — diesel generators, gas engines, UPS, batteries. Firming turns variable renewables into usable firm power via storage, gas balancing, market purchases, or long-duration storage. |
| Losses / Ancillary | Loss and ancillary-service cost | Losses are electrical losses along transmission lines. Ancillary services include frequency regulation, voltage support, spinning and non-spinning reserves, reactive power, black start, and balancing. |
| Taxes / Fees | Taxes and surcharges | Electricity taxes, franchise fees, utility riders, regulatory surcharges, environmental compliance fees, local government charges, and sales tax. These vary widely by state, utility, and tariff. |
In other words, LCOE is the cost on the generation side; Delivered Cost is the real cost on the load side. For a data center, the right question is not "which generation source has the lowest LCOE," but rather:
Which option can deliver enough 24/7-available power at the lowest delivered cost, within the required timeframe?
CCGT: New Combined-Cycle Gas Turbine Plants
A gas turbine generates power first, and the hot exhaust then produces steam that drives a steam turbine for a second cycle of generation. As a result, CCGT efficiency is much higher than simple-cycle gas. CCGT is classic firm power — capable of continuous operation with high capacity factors, well suited as the 24/7 backbone for large-scale data centers. For campuses in the 100 MW, 500 MW, or 1 GW range, if gas supply, permitting, and equipment slots can be secured, CCGT is one of the most mature firm-supply options available.
Simple-Cycle Gas: Aeroderivative Turbines
Aeroderivative turbines such as GE's LM series are derived from aircraft-engine technology and are characterized by fast starts, rapid ramping, and a high degree of modularity. Because simple-cycle efficiency is low and fuel costs are high, LCOE is high. They are best suited as emergency backup, peaking units, rapidly deployable bridging power, and supplemental supply during grid outages.
Reciprocating Gas Engines
Unlike gas turbines, reciprocating engines are piston-based machines with stronger modularity, deployable in stacked banks of tens of megawatts. For data centers in the 10–100 MW range, reciprocating gas engines are faster to deploy than CCGT, making them an important speed-to-power option. They are especially well suited for 10–100 MW phased builds, behind-the-meter supply, and temporary bridging power.
Bloom Solid-Oxide Fuel Cell
Bloom Energy's solid-oxide fuel cells (SOFC) are high-temperature electrochemical devices. They do not combust fuel to drive a rotating machine; they generate electricity directly through electrochemical reactions. Today the primary fuel is natural gas, with hydrogen as a long-term option. They offer a fast-deploy, modular, low-local-emissions solution — but at a high cost. Well suited to projects where speed, footprint, and permitting matter most, but not the right choice as a low-cost firm-power source.
New Large Nuclear (e.g., AP1000)
Large nuclear is the classic high-capex, long-build, low-marginal-cost, low-carbon baseload resource — among the most ideal 24/7 carbon-free firm power sources. For data-center siting, however, it is not a fast supply option for 2026–2030 unless a unit is already under construction or in advanced project development.
SMR FOAK: First-of-a-Kind Small Modular Reactors
The SMR vision is to make nuclear smaller, more modular, and more replicable — a natural fit for data centers' high-load, high-reliability profiles. The first wave of projects, however, lacks full commercial validation, carrying design-certification risk, supply-chain risk, and other first-of-a-kind project risks.
SMR NOAK: Mature Replicated Small Reactors
Mature, replicated SMR projects after several deployments. NOAK cost reductions depend on first-unit success, regulatory stability, supply-chain maturity, and successful project replication.
Existing Nuclear Uprate / Restart
One of the most practical low-carbon firm-power options available, leveraging existing assets — both cost and timeline can be materially lower than building new nuclear.
Utility-Scale Solar PV
Solar generates only during daylight hours and is weather-dependent. Data centers are 24/7 loads that need power around the clock. Standalone solar therefore cannot support a data center; it must be paired with battery storage, gas, or other resources. That said, solar is excellent for lowering daytime power costs and meeting renewable-energy targets.
Onshore Wind
Onshore wind is another low-cost renewable resource, typically with higher capacity factors than solar, especially in wind-rich regions like the U.S. Midwest, Texas, Inner Mongolia, and around the North Sea. Wind, however, is not fully dispatchable: output can be strong at night and then drop off for days at a stretch. A data center cannot "run only when the wind blows."
Offshore Wind
Offshore wind has higher capacity factors than onshore wind and sits closer to coastal load centers — New York, New England, the Mid-Atlantic, and the North Sea region. It is more stable than onshore wind but still not fully dispatchable. Offshore wind is better matched to large coastal loads than onshore wind, though with higher costs and greater project risk. It is well suited as low-carbon supplemental supply in high-priced coastal markets — but it is neither the cheapest nor the fastest option.
4-Hour Lithium-Ion Battery Storage
Batteries are not a generation resource; they are a time-shifting resource. They are well suited for data-center applications such as peak shaving, UPS extension, solar smoothing, and grid services, but cannot support 24/7 load on their own.
Enhanced Geothermal
Enhanced Geothermal Systems (EGS) aim to extend geothermal beyond the few natural hot-spring regions to a much broader geographic footprint. Conventional geothermal relies on natural reservoirs; EGS engineers underground heat-exchange pathways instead. Geothermal is among the best-suited clean firm-power sources for data centers, but current resource availability and project pipeline remain limited.
Coal (Legacy)
Coal is a legacy baseload resource — stable and dispatchable, but with the highest carbon emissions. It explains the historically low electricity prices and high reliability in some regions, but it is not a viable strategy for a new data-center power plan. For hyperscalers, coal carries severe carbon and reputational pressure.
For 24/7 data centers, the options rank roughly as follows:
| Option | Economics | Speed | Reliability | Main issues |
|---|---|---|---|---|
| Utility industrial rate / service | Usually the cheapest in low-rate states, potentially $60–100/MWh | Depends on substation and transmission | High | Main bottlenecks: available capacity, queue position, upgrade work, large-load studies |
| Wholesale / PPA + grid delivery | Low energy prices, especially for wind and solar | Moderate | Requires firming | Not equivalent to 24/7; add capacity, storage, backup, and transmission |
| New CCGT behind-the-meter / on-site | Competitive 24/7 cost | Slow given current turbine backlogs | High | 4–6 years or longer; high CO₂; gas pipelines and permits |
| Reciprocating gas engines / fuel cells | Usually more expensive than utility industrial rates | Fast | High | Best for bridging capacity, backup, and islanded operation; long-term energy cost may not be low |
| Nuclear restart / uprate | Very attractive | Possibly 2–4 years | Very high | Rare projects; complex regulatory and political landscape |
| New nuclear / SMR | Long-term strategic option | Slow | Very high | Not the fastest or cheapest pre-2030 option |
| Wind/solar + 4h battery | Cheap energy | Moderate | Insufficient alone | Cannot cover multi-day low-wind/low-sun periods; needs LDES or firm clean power |
| EGS / Geothermal | Strong long-term potential | Moderate | High | Limited replicable projects today; resource and drilling risk |
| Price type | Typical price range / current reference | Relationship to LCOE |
|---|---|---|
| Wholesale energy price | EIA forecasts a weighted average of about $40/MWh across 11 major U.S. wholesale regions in 2025, with wide regional variation and sensitivity to gas prices. | Only the energy price — not delivered power. Excludes T&D, capacity, backup, congestion, load service, and interconnection upgrades. |
| Corporate renewable PPA | In Q1 2026 North American markets: solar PPAs averaged about $64.49/MWh, wind PPAs about $79.40/MWh. | Typically energy contracts or financial settlements — not 24/7 firm power. Add shape risk, basis risk, firming/storage, transmission, and load-matching costs. |
| U.S. industrial retail rate | February 2026 U.S. industrial average about 8.95¢/kWh = $89.5/MWh; commercial average about 14.37¢/kWh = $143.7/MWh. | Closer to the actual at-the-meter rate, but large data centers face additional special rates, demand charges, substation/line cost sharing, and minimum-load commitments. |
Natural Gas CCGT and Aeroderivative Turbines
Gas CCGTs are the most mature option for new 24/7 power supply, but the binding constraint today is time and equipment backlog.
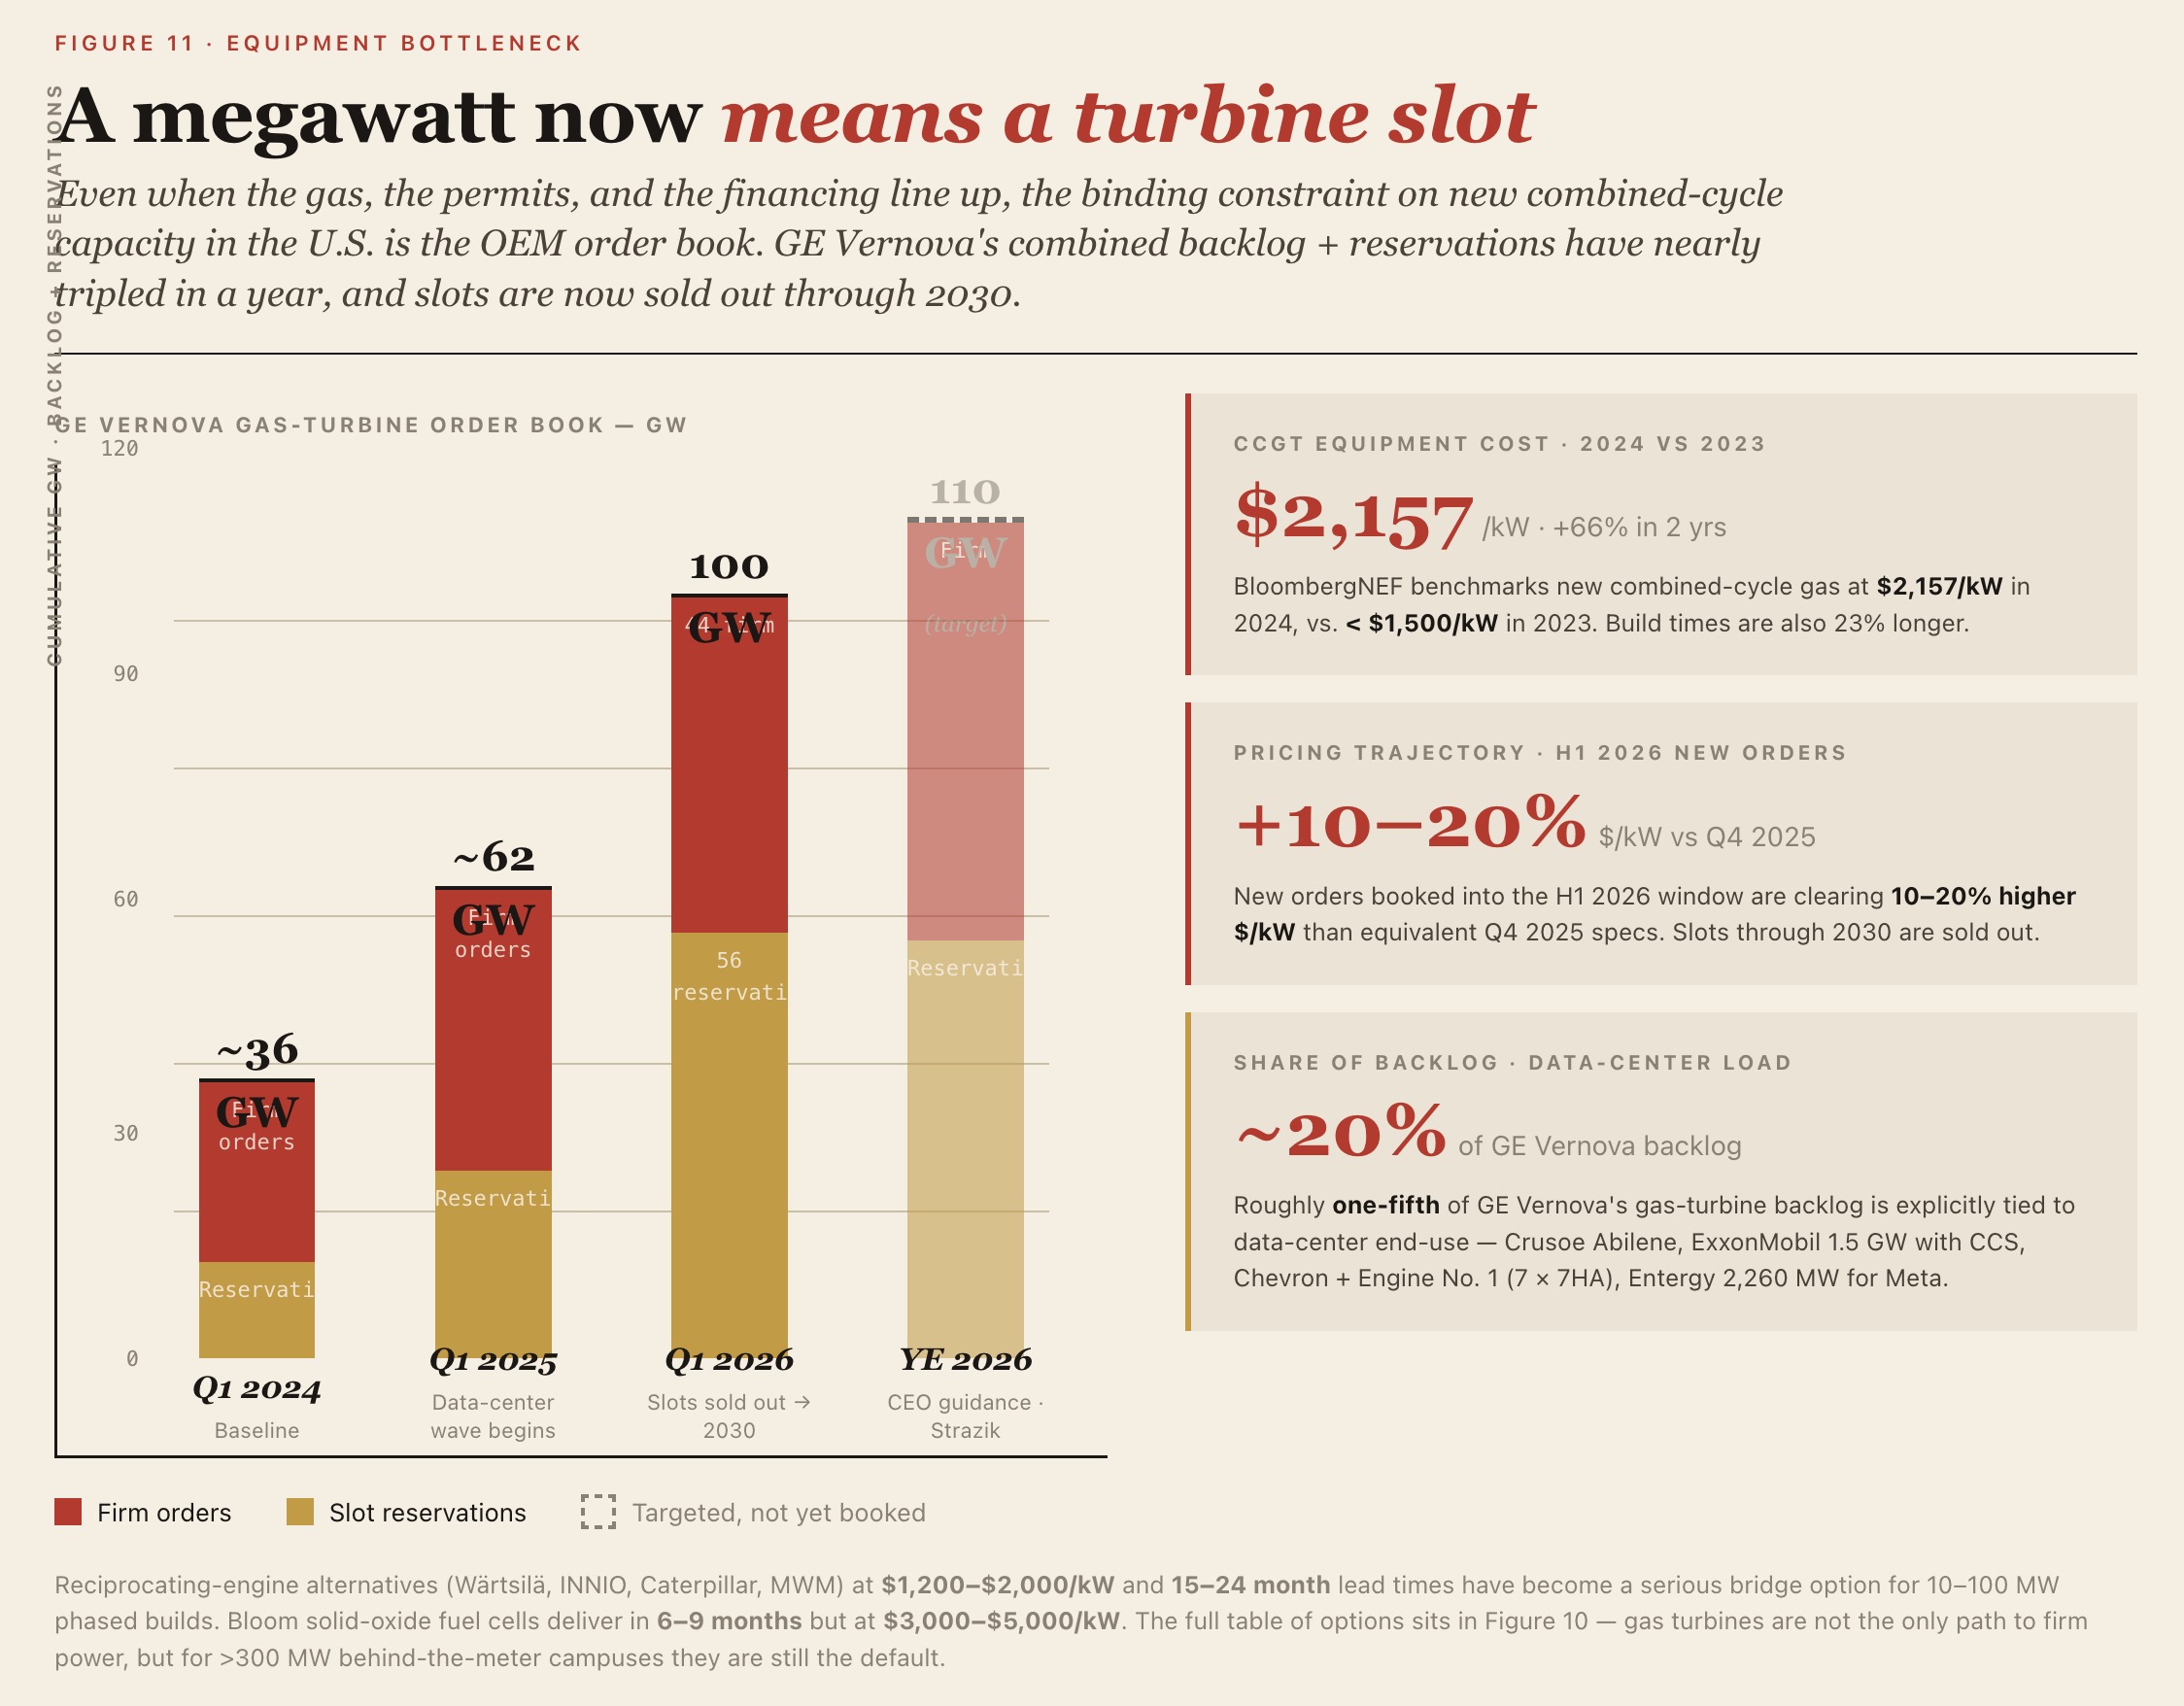
Reciprocating engines (Wärtsilä, INNIO, Caterpillar, MWM) run $1,200–$2,000/kW with 15–24 month lead times, ~38–46% efficiency, and sub-100 MW modular blocks. Simple-cycle aeroderivative turbines (GE LM6000/LM2500, Siemens SGT-A35) carry equipment costs around $1,000–$1,200/kW installed but face 3–5+ year lead times. Industrial frame turbines (F/H-class) are about $700/kW for the machine but >$2,000/kW all-in for a CCGT; BloombergNEF puts new CCGT at $2,157/kW in 2024 (vs. <$1,500 in 2023), up 66% in two years, with build times 23% longer. GE Vernova's gas-turbine reservations + backlog hit 100 GW in Q1 2026 (44 GW firm orders + 56 GW slot reservations); CEO Strazik expects 110 GW by year-end 2026 with slots sold out through 2030. Pricing on new orders in H1 2026 is tracking 10–20% higher $/kW than Q4 2025. About 20% of the backlog is explicitly tied to data centers. Examples include Crusoe's Abilene (TCEQ-permitted 360.5 MW simple-cycle, $500M); ExxonMobil's 1.5+ GW dedicated data-center plant with carbon capture (>90% capture, in service end-2027); Chevron + Engine No. 1 + GE Vernova (seven 7HA turbines, up to 4 GW by end-2027, ~$8B); and Entergy's 2,260 MW for Meta in Louisiana. Permitting: air permits (PSD / Title V), an 18–36 month process; BTM design avoids FERC jurisdiction, but local zoning and water/NOx limits still apply.
SMR Nuclear PPAs
Nuclear has emerged as the preferred option for data centers requiring carbon-free, 24/7 baseload power. The major tech companies are pursuing two strategies: restarting dormant reactor units and investing in the commercialization of small modular reactors (SMRs).
| Hyperscaler | Nuclear strategy | Partner | Reactor technology | Expected capacity |
|---|---|---|---|---|
| Microsoft | Facility restart | Constellation Energy | Pressurized water reactor | 837 MW |
| SMR development | Kairos Power | Molten salt / ceramic fuel | 500 MW | |
| Amazon | SMR / co-location | X-energy / Talen | Gas-cooled / TRISO fuel | 320–960 MW |
| Oracle | SMR deployment | Undisclosed | Next-generation SMR | Multiple units |
![]()
Microsoft's agreement with Constellation Energy to restart the 837 MW Three Mile Island Unit 1 reactor in Pennsylvania is a landmark example of a "speed-to-power" strategy. By refurbishing an existing plant retired only in 2019, Microsoft aims to secure dedicated nuclear capacity by 2028, sidestepping the much longer timeline required for new greenfield construction.
Google and Amazon, by contrast, are investing in SMR technology for long-term scalability and redundancy. Google's agreement with Kairos Power focuses on a fleet of molten-salt-cooled reactors, with the first unit targeted for service in 2030. Amazon is partnering with X-energy and plans to deploy up to 12 SMR modules at its Cascade facility in Washington State.
Nuclear restart and uprate is the highest-quality clean firm power available, but the project universe is small — making it more of a strategic option for the post-2030 horizon.
Texarkana
Texarkana is a classic cross-state twin-city case:
- One side is Texarkana, Texas
- The other side is Texarkana, Arkansas
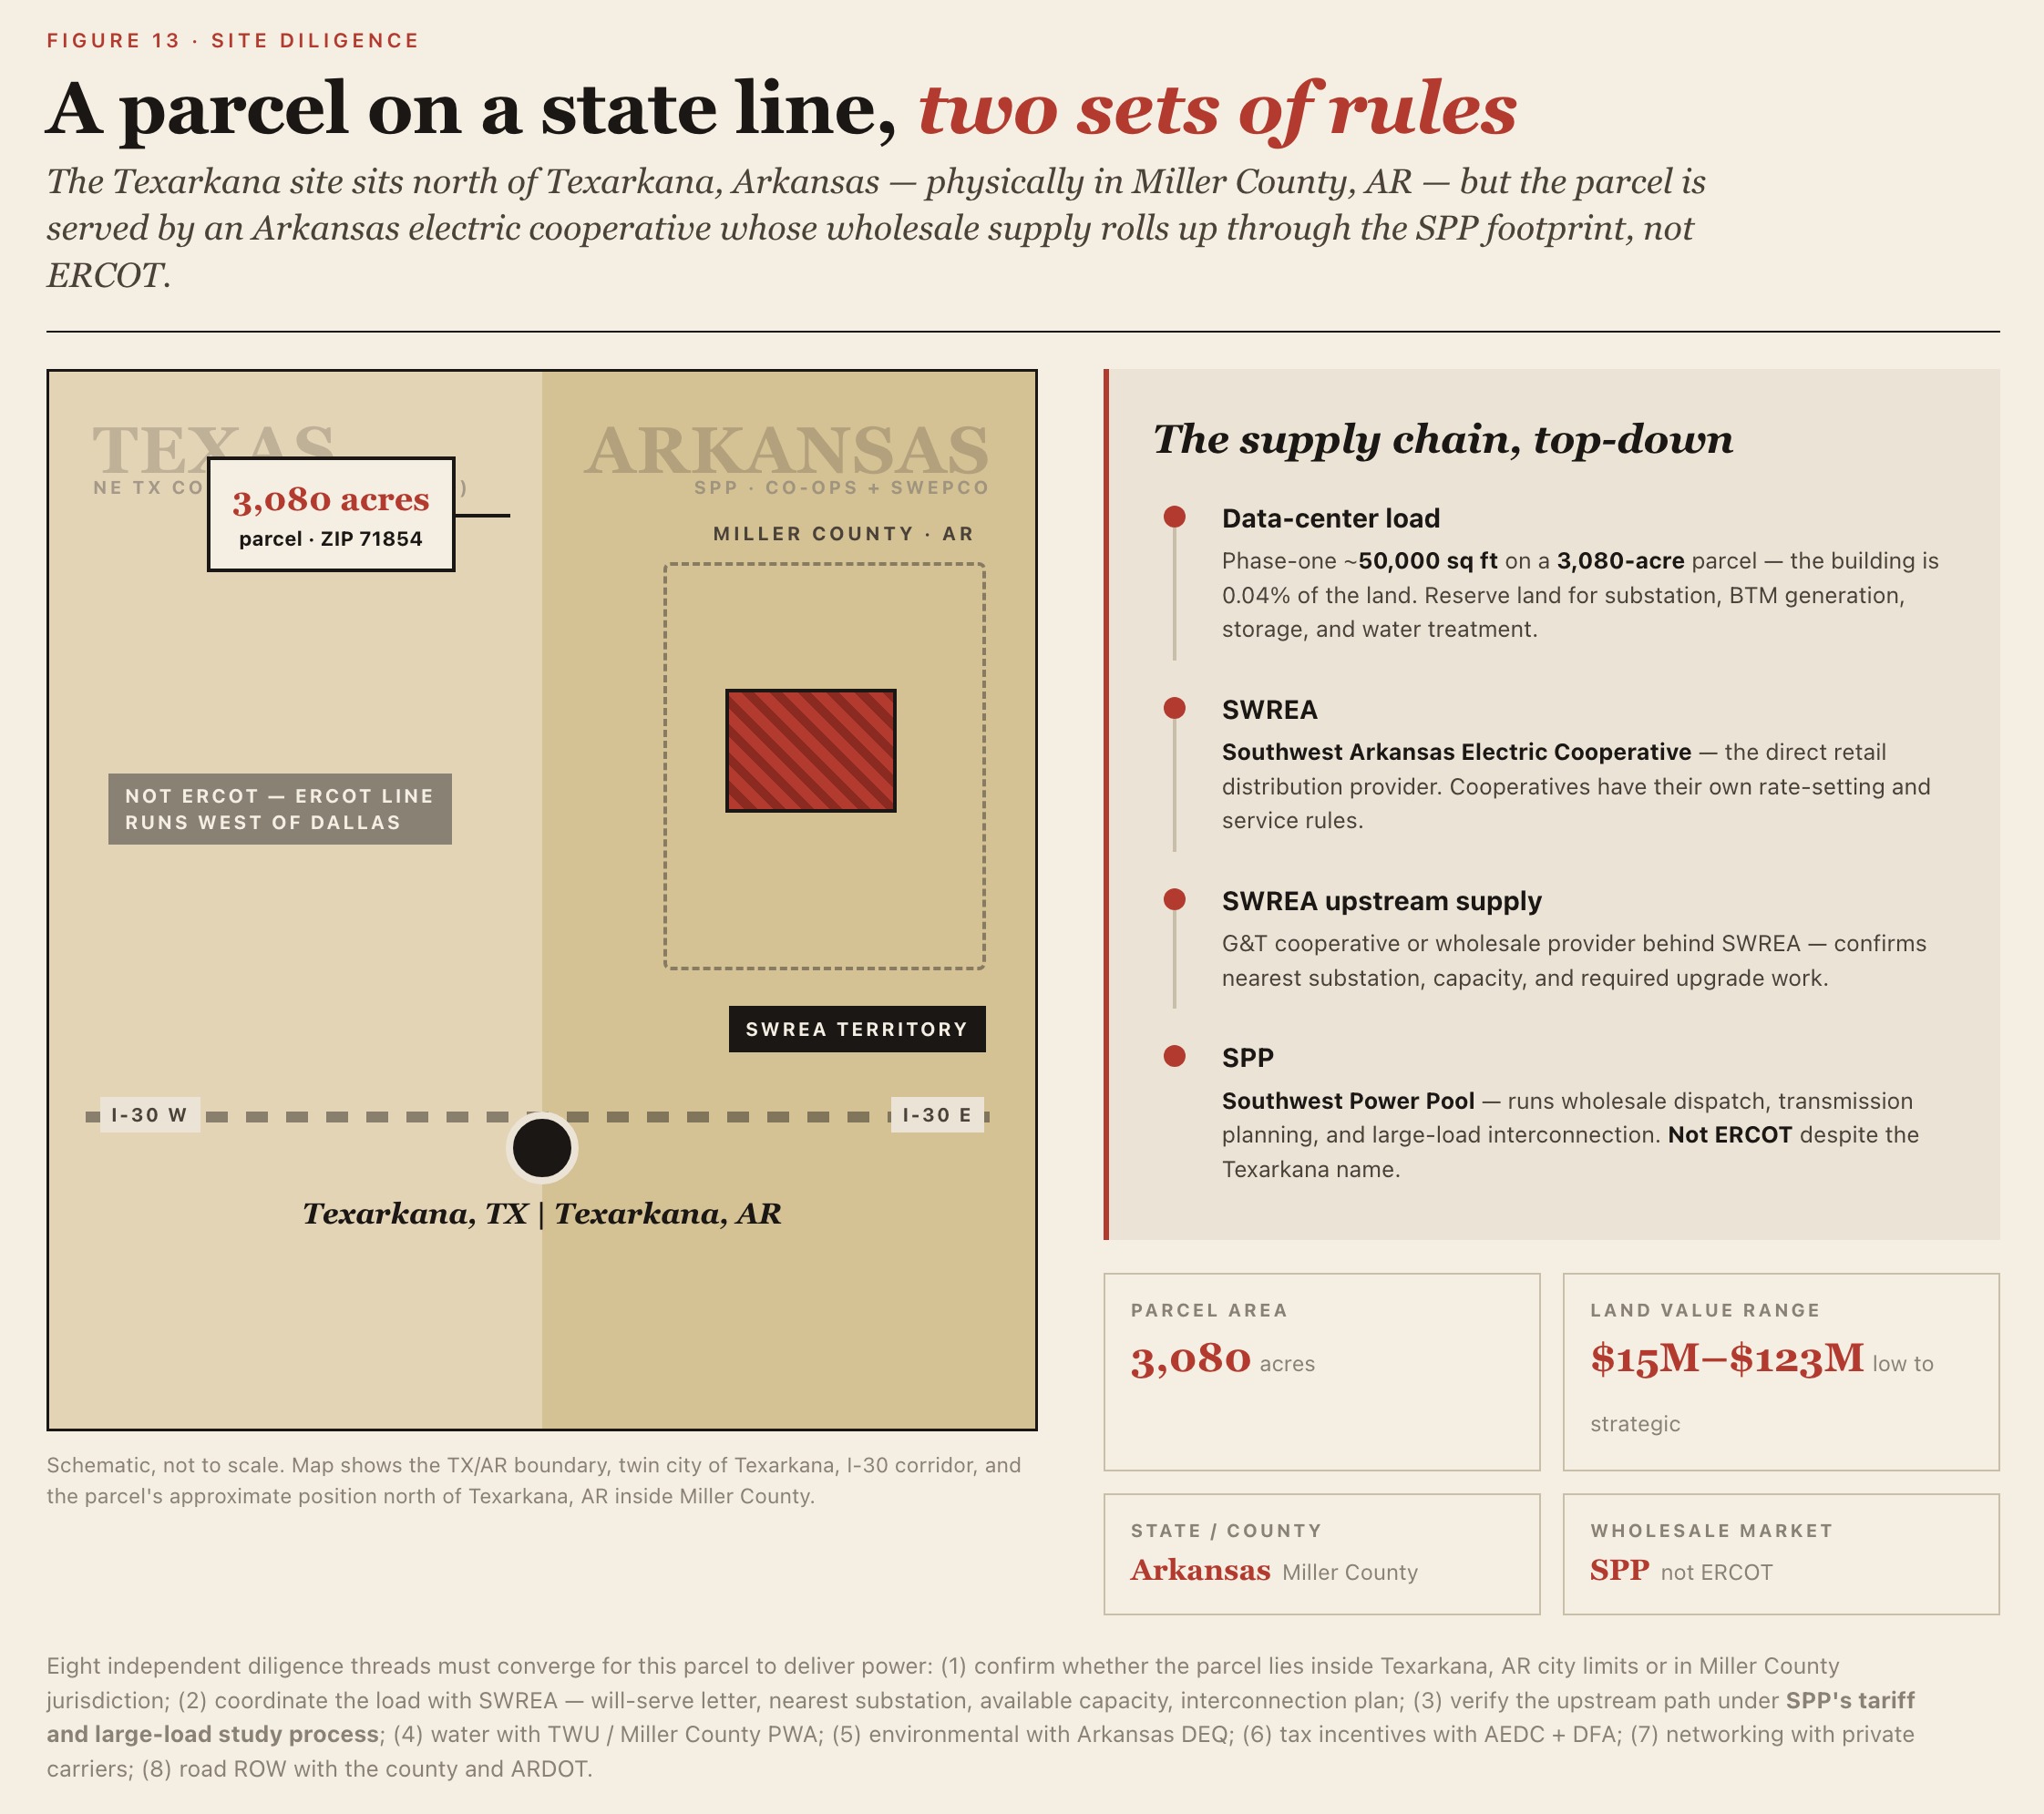
The parcel sits at County Road 55 / Texarkana, Arkansas 71854, classified in property records under Arkansas > Miller County > Texarkana and labeled "A 09 N Of TXK AR" — that is, the area north of Texarkana, Arkansas. Importantly, "Texarkana, AR 71854" may simply be the mailing city/ZIP, which does not necessarily place the parcel inside the Texarkana, Arkansas municipal boundary. Whether the site lies inside the city limits must be confirmed separately through the City Limits layer of Texarkana's official GIS, or through the Miller County / Texarkana AR planning department.
The land controlled by this project is on a dramatically different scale than the current data-center footprint. The total parcel area is about 3,080 acres — roughly 1,246 hectares / 12.46 km² / 134 million sq ft — while the existing or planned data-center building area is only about 50,000 sq ft (roughly 4,645 m² / 1.15 acres), occupying only about 0.04% of the total. The project should therefore not be read as a "50,000 sq ft standalone data center" but as an early-stage energy and compute campus with an oversized land bank: 50,000 sq ft is likely just a phase-one or existing building, while the 3,080 acres reserve room for future phases, a substation/switchyard, behind-the-meter generation, energy storage, roads, buffer zones, water treatment, and potential on-site solar or gas resources. On valuation:
| Valuation basis | $/acre | Implied total for 3,080 acres |
|---|---|---|
| Farmland / forestland / remote bulk land | $5,000–$10,000/acre | $15.4M–$30.8M |
| Miller County average land market | ~$16,000–$17,000/acre | ~$49M–$52M |
| Texarkana / 71854 more development-oriented land | ~$22,000–$23,000/acre | ~$68M–$71M |
| Strategic site with clear industrial / power / data-center value | $25,000–$40,000+/acre | $77M–$123M+ |
Because the parcel is confirmed to be served by SWREA (Southwest Arkansas Electric Cooperative) and sits next to SWREA facilities, the upstream grid and wholesale dispatch should be analyzed under the SPP (Southwest Power Pool) framework — not ERCOT, and not, by default, MISO. The next-step focus for siting diligence should be to confirm with SWREA: the nearest substation, available capacity, an interconnection plan for the target MW load, the required upgrade work, the interconnection timeline, applicable rate options, and whether the project must enter SPP's large-load interconnection or transmission-study process.
Data center / end load
        ↓
SWREA: direct retail electric service provider / distribution cooperative
        ↓
SWREA upstream supply and transmission arrangements
        ↓
SPP: wholesale market, high-voltage transmission dispatch, transmission planning, large-load studies
In one line: confirm parcel boundaries and jurisdiction with Miller County / Texarkana AR; coordinate power with SWREA and verify upstream transmission and the SPP large-load process; coordinate water with TWU / Miller County PWA; coordinate environmental matters with Arkansas DEQ; coordinate tax incentives with AEDC + DFA; and coordinate networking with carriers along with road ROW permits.
| Module | Lead agency / counterpart | Key items to complete or confirm |
|---|---|---|
| State / county / city jurisdiction | Arkansas / Miller County / possibly Texarkana AR city limits | First confirm whether the parcel lies within Texarkana, Arkansas city limits — this determines whether local planning, building permits, fire safety, and road interfaces are handled by the city or by the county. "Texarkana, AR 71854" may simply be a mailing city/ZIP, not a guarantee of being inside the city limits. |
| Parcel / title / property tax | Miller County Assessor / Tax Collector / Circuit Clerk | Pull parcel data, area, valuation, land class, tax, deed, mortgage, lien, and easement records. |
| Land use / zoning / construction permits | Inside city limits: Texarkana AR Planning & Zoning / Building Permits; outside city limits: relevant Miller County depts. | Confirm whether data-center / industrial use is permitted; whether rezoning, special-use approval, site-plan approval, building permits, or grading permits are required. |
| Roads / construction access / heavy-vehicle routing | Miller County Road Department; ARDOT if the connection touches a state road | For County Road / Springer Rd routes, first confirm road ownership; heavy commercial vehicles may need road permits; if a project entrance ties to a state-managed road, engage ARDOT. |
| Electricity supply | Southwest Arkansas Electric Cooperative (SWREA) | Service is confirmed via SWREA. Obtain a service confirmation / will-serve letter, a load-capacity assessment at the target MW, the nearest substation/feeder/voltage level, currently available capacity, expansion plan, interconnection timeline, and industrial/large-load rate options. |
| Upstream grid / RTO | SPP (Southwest Power Pool) / SWREA's upstream transmission provider | This is not ERCOT territory. Confirm whether the upstream transmission path falls under the SPP tariff / SPP transmission planning, and whether project size triggers the SPP HILL / HILLGA large-load study process. |
| Electricity regulation | Arkansas Public Service Commission (APSC) / SWREA cooperative governance / SPP-FERC tariff framework | Arkansas-side electric service, service-territory issues, and certain utility matters may involve the APSC; as a cooperative, SWREA also has its own rate and service rules; SPP tariff or large-load processes may bring FERC/SPP into the framework. |
| Water supply | Texarkana Water Utilities (TWU) / Miller County PWA | Obtain water availability / will-serve letter, pipe diameter, water pressure, fire flow, expansion costs, and cooling-water capacity. |
| Wastewater / industrial pretreatment | TWU Environmental Services / Industrial Pretreatment Program | Confirm sanitary sewer access; whether a wastewater discharge permit is required; whether cooling-tower blowdown, chemicals, and non-sanitary wastewater fall under pretreatment regulation. |
| Construction stormwater / SWPPP | Arkansas Division of Environmental Quality (DEQ) | Major construction disturbance typically triggers the construction stormwater general permit, NOI, SWPPP, on-site inspections, and sediment/runoff controls. |
| Industrial wastewater / NPDES / no-discharge permits | Arkansas DEQ Water Permits | If discharge is not solely via the TWU sewer — direct discharge, special process wastewater, no-discharge systems, or subsurface/surface treatment — pursue the DEQ water-permit / NPDES route. |
| Water withdrawal / wells / surface water | Arkansas Department of Agriculture — Natural Resources Division | If municipal water is not the sole source — wells, surface water, or non-riparian withdrawals — confirm water-use registration or non-riparian water-use certification. |
| Backup diesel generators / air emissions | Arkansas DEQ Air Permits Branch | Diesel generator banks may require air permits and limits on NOx/PM/VOC/CO emissions, operating hours, and emergency vs. non-emergency classification. |
| Diesel tanks / fuel storage | Arkansas DEQ Regulated Storage Tanks Section + local fire authority | Underground/aboveground fuel tanks: leak prevention, secondary containment, registration, inspections, and reporting. |
| Fire / life safety / fire plan review | Local fire authority + Arkansas State Fire Marshal's Office | Review of fire access, sprinklers, alarms, gas suppression, diesel systems, UPS/battery rooms, hazardous materials, and NFPA/IFC compliance. |
| Sanitary wastewater / septic | Arkansas Department of Health / County Health Unit | If no public sewer is available and an on-site wastewater system is used, confirm ADH requirements. |
| Network / fiber | Private carriers including AT&T, Windstream, Zayo, and Lumen; for first-pass screening use the FCC National Broadband Map | Confirm dark fiber, lit service, diverse routes, carrier hotels, latency, and redundant paths; data-center-grade service requires custom routing and capacity from the carrier. |
| Fiber / utility ROW construction | Miller County Road Department / Texarkana AR / ARDOT | Fiber, electric, water, and sewer construction that requires road cuts, ROW crossings, pole attachments, or street occupation needs ROW / utility permits from the road owner. |
| Tax incentives / sales-and-use-tax exemptions | Arkansas Economic Development Commission (AEDC) + Arkansas Department of Finance and Administration (DFA) | Data-center tax incentives do not live with AEDC alone: obtain AEDC's positive cost-benefit analysis, then apply to DFA for the corresponding financial-incentive certificate / exemption. |
| Local incentives / PILOT / supporting infrastructure | Miller County / Texarkana AR / Texarkana USA Chamber / local economic development entities | Negotiate property-tax abatement, PILOT, supporting road/water/power infrastructure, development agreements, and local political support. |