TL;DR
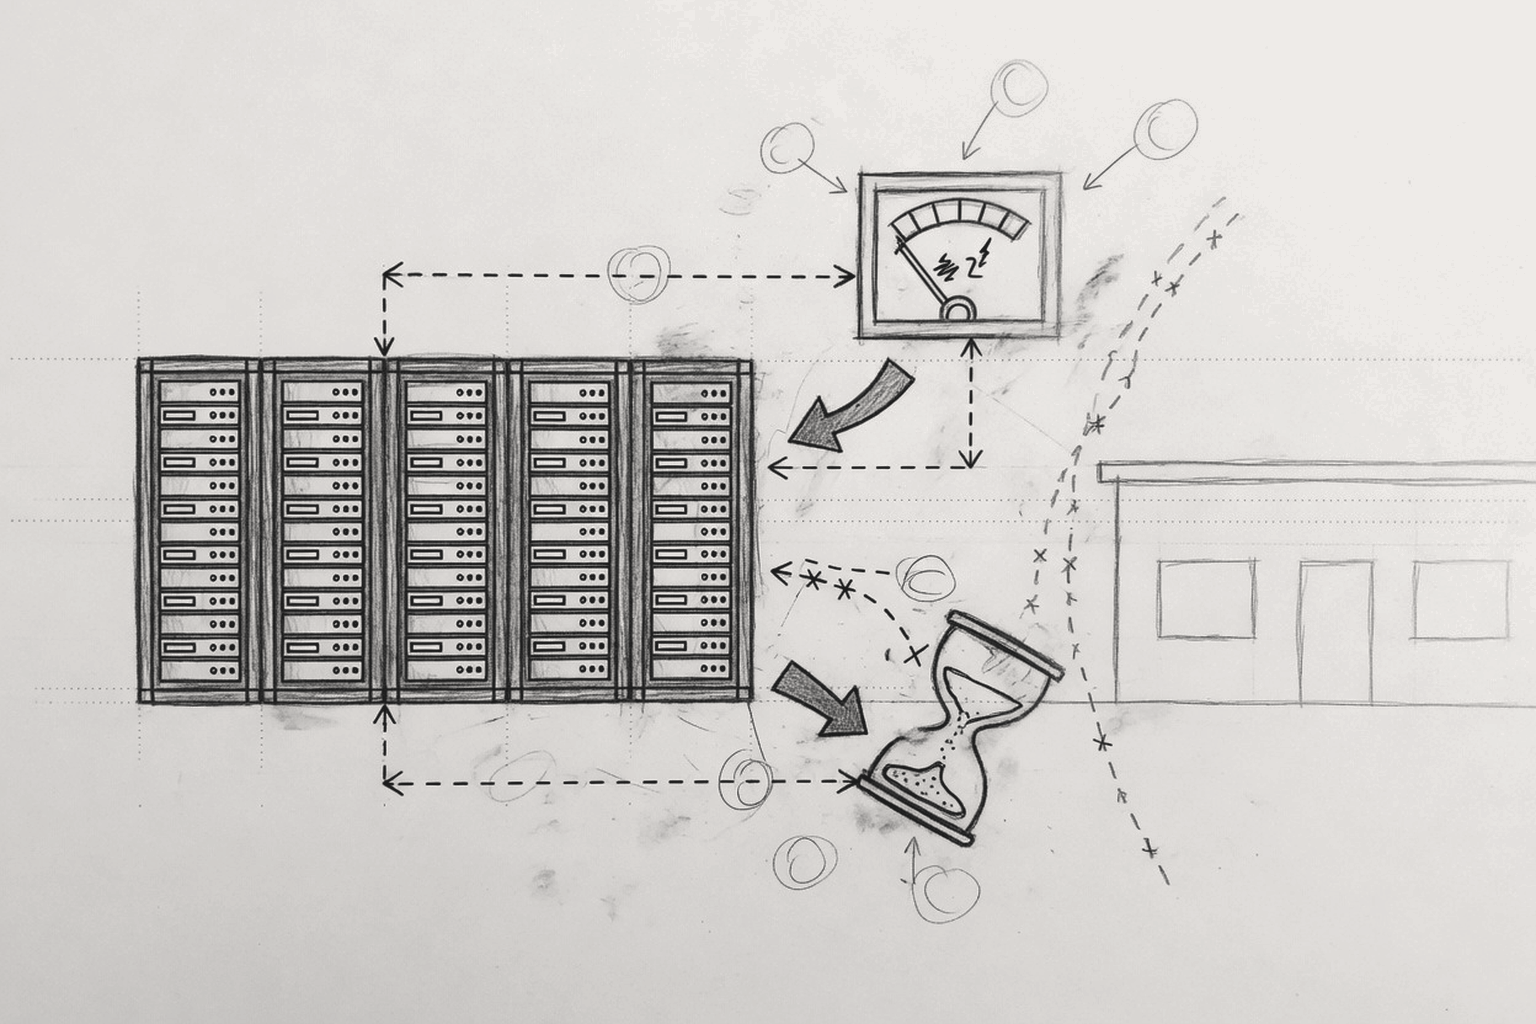
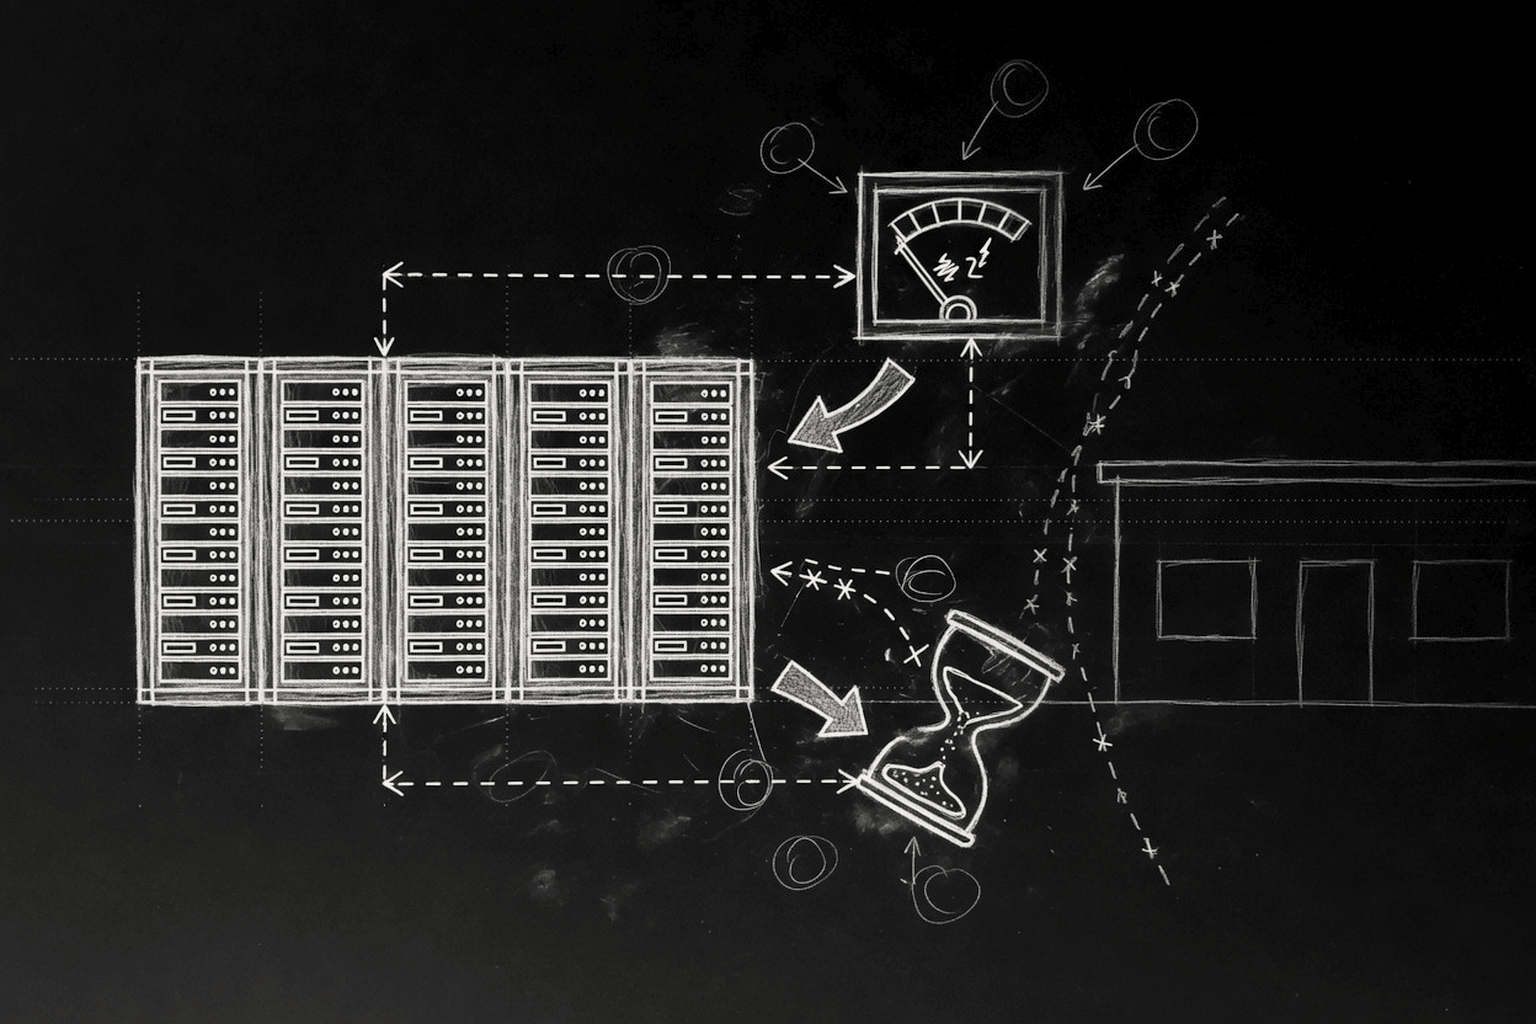
A NeoCloud is not a miniature hyperscaler. In its purest form it is a balance-sheet business that buys accelerators, parks them on contracted power, and sells GPU-time—often as bare metal, sometimes as Kubernetes or slurm-wrapped clusters. The public narrative emphasizes backlog and megawatts. The private spreadsheet emphasizes four clocks that rarely align: hardware purchase ramp, colo energization lag, customer occupancy ramp, and price decay across a GPU generation.
This article does three things. First, it places NeoCloud in the supply stack between wholesale AI data centers and hyperscale GPU clouds. Second, it decomposes bare-metal rental into hardware cost, data-center host cost, team cost, and revenue, separating fixed parameters from assumptions you should be allowed to edit. Third, it ships an interactive three-year model—summary KPIs plus a full monthly revenue and cash-opex table—so a reader can see when a “high EBITDA margin” story still fails cash payback.
The default case is intentionally tight: new-build H100-class capex near $30k per GPU, list rental near $1.68 per GPU-hour, 36-month economic life, and ordinary colo and payroll drag. Under those inputs the model often prints strong mid-period EBITDA while cumulative free cash remains negative inside the horizon. That is not a bug in the calculator. It is the NeoCloud problem statement.
1. What a NeoCloud Actually Sells
1.1 Definition and boundary
NeoCloud is the market label for AI-native GPU clouds that grew outside the classic hyperscaler trio. Operators such as CoreWeave, Lambda, Crusoe, Voltage Park, Together, and a long tail of regional hosts typically share four traits:
- Owned or financed GPU fleets rather than pure software brokerage.
- Leased or joint-venture power shells rather than owning the entire campus stack end-to-end (with exceptions such as energy-integrated players).
- High-density networking (InfiniBand / Ethernet fabrics) sized for training and multi-node inference, not general-purpose multi-tenant VMs.
- Contract shapes closer to capacity leases—reserved clusters, take-or-pay blocks, or multi-month bare-metal terms—than to infinite on-demand elasticity.
The product customers think they buy is “H100s” or “B200s.” The product the P&L actually sells is billable GPU-hours on a financed asset, inside a power envelope, under an SLA, after sales leakage. Confusing the chip with the hour is how decks overstate returns.
1.2 Position in the AI infrastructure stack
| Layer | What is sold | Dominant cost | Typical buyer |
|---|---|---|---|
| Power / land / interconnect | MW, water, fiber, entitlements | Grid, generation, civil works | Hyperscalers, developers, utilities |
| Wholesale AI colo / powered shell | $/kW-month capacity | Building, cooling, electrical | NeoClouds, enterprises, clouds |
| NeoCloud bare metal / GPU cloud | $/GPU-hour or cluster-month | GPU + fabric + colo + ops | Labs, AI apps, enterprises |
| Hyperscale GPU SKUs | Managed instance families | Fleet + software + sales | Broad developer base |
| Model / agent platforms | Tokens, apps, outcomes | Model, data, product | End users |
NeoCloud gross margin is therefore a spread: rental price per hour minus the cash cost of keeping that hour alive. Depreciation is not optional intellectually even when lenders underwrite EBITDA. A six-year accounting life on a three-to-four-year economic life is a financing choice, not a physics result.
1.3 Bare metal versus managed GPU cloud
Bare metal is the cleanest unit-economic object. The customer receives nodes (or NVL racks), brings a runtime, and pays for reserved capacity. Managed Kubernetes, serverless inference, and multi-tenant slicing add attach revenue—and support cost, noisy-neighbor risk, and product complexity. The calculator below models bare-metal rental with a simple attach rate for storage, egress, and support. It does not model multi-tenant packing efficiency above the stated occupancy rate; if you believe packing beats 99% “sold occupancy,” raise occupancy rather than hiding the claim.
2. Three Cost Layers and One Revenue Engine
Every NeoCloud bare-metal deal can be forced into four blocks. Mixing them is how models double-count power or forget that payroll is mostly fixed.
2.1 Hardware (balance sheet)
- GPU purchase price today — fixed for a given vintage until you change the quote.
- GPU count, GPUs per node or NVL rack — scale and fabric topology.
- Ancillary hardware ratio — CPU, DRAM, NIC/HBA, IB switches, cables, racks, PDU share; default 15% of GPU sticker.
- Depreciation length and salvage — accounting life versus residual value at exit or refresh.
- Ramp to full bought — cash does not leave on day zero if delivery is staged.
- NRC per GPU — one-time fit-out, integration, and racking cash, amortised with the asset.
Annualized failure rate (AFR) does not always reduce billable hours if hot spares exist; it does force a spares and maintenance cash budget. The model charges AFR × GPU price / 12 on the deployed base.
2.2 Data-center hosting (mostly operating cost)
- GPU power (kW per GPU) and PUE — drive both reserved kW and metered energy.
- AIDC base rent ($/kW/month) — capacity charge on reserved IT power, escalated annually.
- Metered energy ($/kWh) — facility draw approximated as IT load × PUE.
- Management rack ratio — default 1:8, expanding reserved kW for management and storage racks.
- Signed-to-deployment gap — months between hardware arrival and revenue service.
- Ramp to full deployment — how fast contracted power is reserved on the landlord contract.
- Average occupancy — sold fraction of deployed GPUs after commercial ramp.
- SLA credits and bad-debt / churn allowance — revenue haircuts, not opex lines.
2.3 Team and G&A
A thin bare-metal pod can run with a small site reliability and customer operations footprint. Defaults: 3 people at $100k average fully loaded cash cost, plus a fixed other-G&A stub and a sales commission on net revenue. This understates a public NeoCloud’s corporate overhead; it is closer to a single-cluster economic unit than to company-level SG&A.
2.4 Revenue
- Rental price ($/GPU-hour) — default $1.68 on the locked path.
- Price decay or locked — multi-year reserved deals often lock; spot and renewals decay with the generation.
- Lease length — billing window from first deployment.
- Ramp to full occupancy — commercial fill after energization.
- Attach rate — storage, egress, support as a percent of GPU rental.
2.5 Metrics that are easy to omit
Beyond headline ROI, the model surfaces:
- Initial invested capital — GPU + ancillary + NRC (financing not modeled).
- Peak funding need — deepest cumulative free-cash trough while hardware is still ramping.
- Cash payback — months until cumulative free cash (EBITDA − capex − NRC) crosses zero; ignores depreciation by construction.
- Accounting payback — months until cumulative EBIT covers initial capital; forces depreciation into the recovery test.
- 36-month cash ROI and IRR — terminal wealth and rate-of-return views on the same cash path.
- EBITDA margin and realized $/GPU-hour — quality of revenue after ramps and decay.
- Fixed cash opex memo — rent, admin, payroll, insurance-like lines that do not scale down cleanly when occupancy slips.
Not modeled, and material in real deals: debt draws and interest, GPU collateral advance rates, customer concentration, power curtailment, liquid-cooling premiums, import duties, and residual-value execution risk. Treat the sheet as a cluster underwriting sandbox, not a full corporate LBO.
3. Interactive three-year bare-metal calculator
Edit assumption fields (solid borders). Fixed commercial inputs use dashed borders but remain editable so quotes can be updated. Presets for H100 / H200 / B200 / GB200 NVL72 overwrite GPU price, power, and GPUs per node. The monthly grid is wide on purpose—scroll horizontally like a workbook.