TL;DR
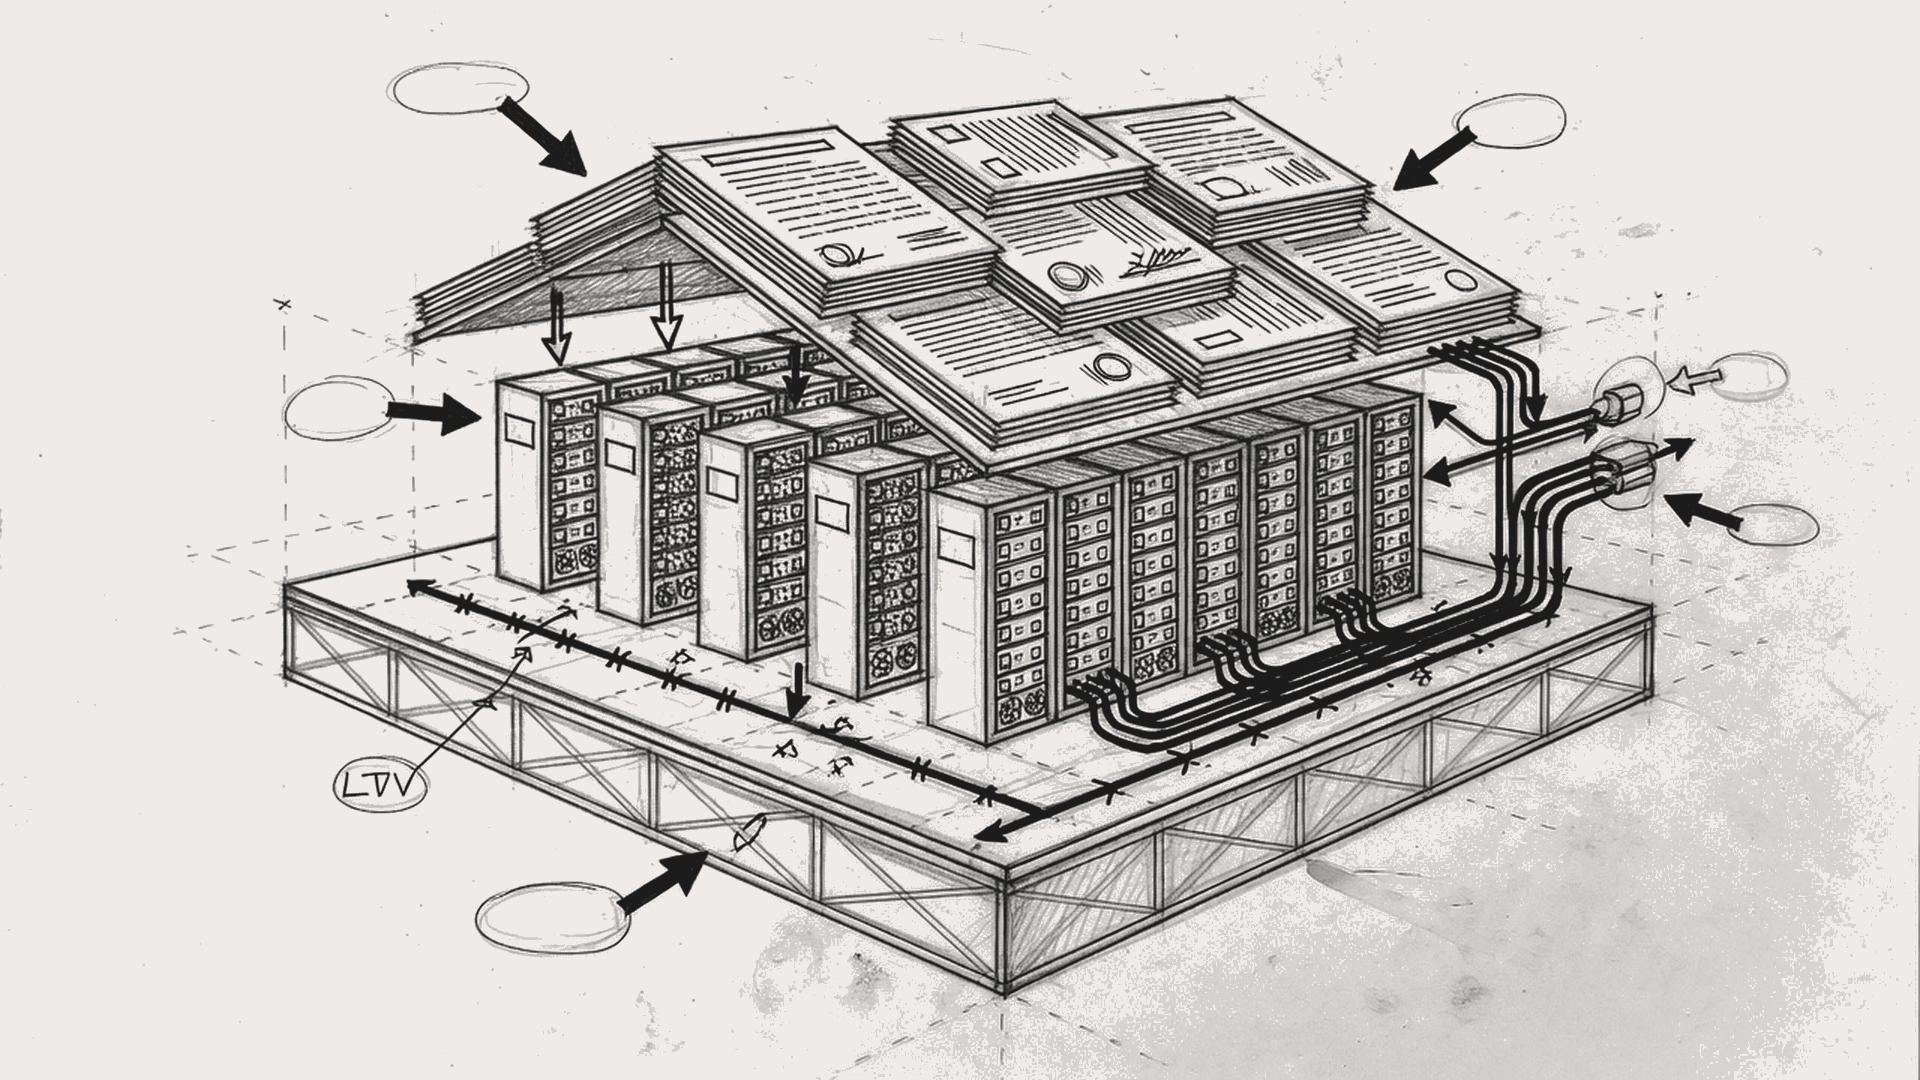
CoreWeave is not a cloud computing company. It is a compute factory driven by $35B of debt leverage, covered by $104B of customer contracts, and timed to NVIDIA GPU generation cycles.
The factory runs as follows: first lock capacity with data-center leases ($47.3B of off-balance commitments), then lock revenue with take-or-pay customer contracts (98% committed), then borrow against those contracts on Wall Street to buy GPUs (DDTL evolved from ~15% pawnshop rates to A3 investment-grade), and finally rack the GPUs and deliver compute. Three pipelines run in parallel, bound by one hard constraint—costs tick monthly/quarterly on a clock, while revenue starts only when all three lines converge.
In four years the factory produced a $229M → $12.8B revenue trajectory, at the cost of ~$87B in broad obligations (on-balance debt + leases + off-balance commitments) locking 84% of backlog. Reported gross margin of 66% is an illusion—GPU depreciation sits outside cost of revenue; economic gross margin is only ~12%. Of every $4 earned, $1 goes to interest, $2 to depreciation, and $1 covers everything else. Q2 delivered the first margin-expansion inflection (Adj. Op.Inc $21M→$128M), but positive FCF will not arrive until the capex cycle completes.
CoreWeave’s success condition and failure condition are the same thing: GPU supply shortage. When that holds, customers race to sign, NVIDIA prioritizes allocation, Wall Street funds confidently, and the flywheel accelerates. When it flips—hyperscalers catch up on self-build, custom silicon matures, GPU cloud becomes a buyer’s market—$47.3B of non-cancelable lease obligations do not disappear, $35B of debt interest does not stop, but customers may reprice or not renew. CoreWeave cannot realistically sue Microsoft, which is 67% of its revenue, for performance.
That is why CoreWeave spent $1B on W&B and is pushing Managed Inference: before the GPU-allocation windfall fades, it must upgrade from a hardware lessor selling GPU-hours to a software vendor selling AI platform services. Together those two are still under 2% of revenue—the pivot is a direction, not yet a reality.
1. Company History and Transformation
CoreWeave’s origin story is retold as miner-turned-AI-cloud. The reality was less idealistic.
| Period | Event |
|---|---|
| 2017 | Founded in New Jersey as Atlantic Crypto. Three founders: Michael Intrator (hedge-fund background, Hudson Ridge Asset Management), Brian Venturo, Brannin McBee. Initial business: mining Ethereum with GPU rigs. |
| 2018 | Ethereum price collapse (~$1,400→~$85). PoW mining economics broke. GPU hardware sat idle. |
| 2019 | Critical pivot: rebranded as CoreWeave, formally pivoted to GPU-as-a-Service. First customers were VFX/animation render studios. GPU cloud across 7 facilities. Became an early NVIDIA Cloud Partner. CTO Peter Salanki joined (later granted co-founder title). |
| 2020-2022 | Gradual shift from VFX/rendering to AI/ML workloads. NVIDIA Elite Cloud Partner certification. Remote-render demand during COVID supported the business. Began building a Kubernetes-native stack. Formally exited all Ethereum mining in 2022 (confirmed in 10-K Part I). |
| 2023 | Year of the AI breakout. ChatGPT (Nov 2022) ignited training demand; H100s were scarce. CoreWeave, as the largest third-party NVIDIA GPU cloud, was a primary beneficiary. August: first-ever GPU-collateral financing—Blackstone/Magnetar US$2.3B (DDTL 1.0, effective rate ~15%). FY2023 revenue US$229M. NVIDIA began treating CoreWeave as a strategic partner (priority supply). GPU useful life raised from 5 to 6 years (effective 2023-01-01). Sites: 10 data centers, ~70 MW. Headcount ~250–650 (range estimate). |
| 2024 | Exponential scale. May: another US$7.5B of debt (DDTL 2.0/3.0). Microsoft signed as cornerstone customer (62% of FY24 revenue). FY2024 revenue US$1.915B (+736% YoY). Headcount from hundreds to 881 (YE24, S-1). Sites: 32 data centers, ~360 MW. |
| 2025 | March: NASDAQ IPO (CRWV) at $40, raising ~$1.5B. May: acquired Weights & Biases ($1,029M accounting value), upgrading from “rent cards” to “AI cloud platform.” August: DDTL 4.0 $8.5B. NVIDIA invested $2B (~10.55% stake). FY2025 revenue US$5.131B (+168%). Headcount to 2,189 (YE25). Revenue backlog hit $66.8B. Sites: 43 data centers, >850 MW. |
| 2026 H1 | Q1 revenue $2.078B, Q2 $2.575B. Backlog rose from $99.4B to $129.2B (as of Aug 11). Active power from >1 GW to 1.5 GW. DDTL 5.0 $3.1B + >$10B unsecured notes/convertibles (including first Eurobond). Added to Nasdaq-100 (6/22). FY26 guidance raised to $12.4–13.2B. Sites: 49+ data centers. |
Figure 1.1. CoreWeave timeline: mining → VFX GPU cloud → AI NeoCloud scale-up. Key financing and capacity milestones annotated.
In 2017, founders Michael Intrator (hedge-fund background, Hudson Ridge Asset Management), Brian Venturo, and Brannin McBee formed Atlantic Crypto in New Jersey to mine Ethereum with GPUs. In 2018 ETH collapsed from $1,400 to $85 and the hardware sat idle. In 2019 the company rebranded as CoreWeave and re-leased idle GPUs to VFX (visual effects) and rendering studios—film VFX, 3D animation, and game cinematics need massive GPU time to compute frames one by one; a high-quality CG frame can take minutes to hours on GPU, and a film has hundreds of thousands of frames, so studios need large GPU fleets only for the duration of a project—naturally suited to on-demand cloud GPUs. The same mining cards became Hollywood render farms. This was not foresight-driven transformation; it was survival instinct—idle GPUs lose money, so rent them to whoever will pay.
After ChatGPT ignited AI training demand in 2023, GPU buyers shifted from render studios to AI labs—the same hardware served three entirely different markets in three years (mining → rendering → AI training), each time because the prior market’s demand faded just as the next market’s demand appeared. CoreWeave’s core capability is not trend prediction; it is rapidly pivoting to the highest-paying GPU buyer as demand tides shift.
The core endowments still carried forward and later powered exponential growth:
First, GPU hardware operations DNA. Miners must manage thermal control, power draw, and failure rates on large GPU fleets 24/7—experience that transferred directly to AI cloud ops. CoreWeave’s Kubernetes-native stack was not an academic greenfield project; it grew out of mining-farm operations engineering.
Second, relationship capital with NVIDIA. Miners were among NVIDIA’s largest non-gaming GPU customer cohorts. Eight years of relationship converted, in the AI era, into priority on new-card allocation—CoreWeave was a first-wave NeoCloud deployer for both GB300 and Vera Rubin. That is not accident; it is compounded relationship capital.
| Fiscal year | Revenue | YoY | Data centers | Active Power |
|---|---|---|---|---|
| FY2023 | $229M | — | 10 | ~70 MW |
| FY2024 | $1,915M | +736% | 32 | ~360 MW |
| FY2025 | $5,131M | +168% | 43 | ~850 MW |
| FY2026E | ~$12,800M | +150% | 49+ | 1.5 GW (Q2) |
Figure 1.2. Revenue trajectory FY2023–FY2026E. FY26E uses company guidance midpoint (~$12.8B). Growth is contract-driven, not long-tail organic.
Annual revenue from ~$0.2B to ~$13B took only four years—faster than the ~10 years AWS needed to reach $10B. The growth paths are not comparable: AWS sits on the long tail of millions of developers; CoreWeave sits on committed contracts with no more than ~10 large customers. AWS’s $10B was the compound interest of organic growth; CoreWeave’s $13B is contract-driven leveraged output—~85% of FY25 growth came from existing-customer expansion, only ~15% from new customers.
2. Core Resources and Capabilities
CoreWeave’s operations rest on four resources—data centers, GPUs, customer contracts, and financing channels—not as independent inputs but as a flywheel of three pipelines advancing in parallel under one hard constraint. Understanding the machine requires understanding how those four resources coordinate.
Operating flywheel: three parallel pipelines
CoreWeave does not run the linear sequence “find customer → find facility → buy cards → finance.” Three pipelines advance simultaneously, chained by one hard constraint:
- Pipeline A: data-center capacity. CoreWeave signs data-center leases moderately ahead of demand—locking facilities before customers are fully in place, because DC construction takes 12–24 months and waiting until customers arrive is too late. The $47.3B off-balance lease commitment is the direct result of this “bet capacity first” strategy. It is a capital-intensive wager: if customers do not come, rent is still paid.
- Pipeline B: customer contracts. Advanced in parallel with DC signing; some contracts are signed before DCs are ready (backlog definition includes “subject to delivery and/or availability of capacity”), but with delivery conditions—no energization, no revenue recognition. That is why $104B of backlog far exceeds currently deliverable capacity.
- Pipeline C: GPU procurement. Queue with NVIDIA, confirm allocation, place POs, wait for delivery. This pipeline is driven by NVIDIA’s allocation decisions (a black box) and global GPU supply/demand.
The only hard constraint: customer contract → DDTL draw → GPU payment. The S-1 states: "CoreWeave does not procure GPUs until after signing its own cloud customer contract." DDTL facilities require dual collateral of “investment-grade customer contract + GPU hardware”—no contract, no draw; no draw, no card payment. This is a sequence enforced by financing mechanics, not a management preference.
Revenue recognition = all three pipelines in place. DC energized + GPUs racked + customer acceptance → ratable ASC 606 revenue recognition begins (typically ~3 months after signing). Any pipeline delay blocks recognition—while DC rent and DDTL interest already run.
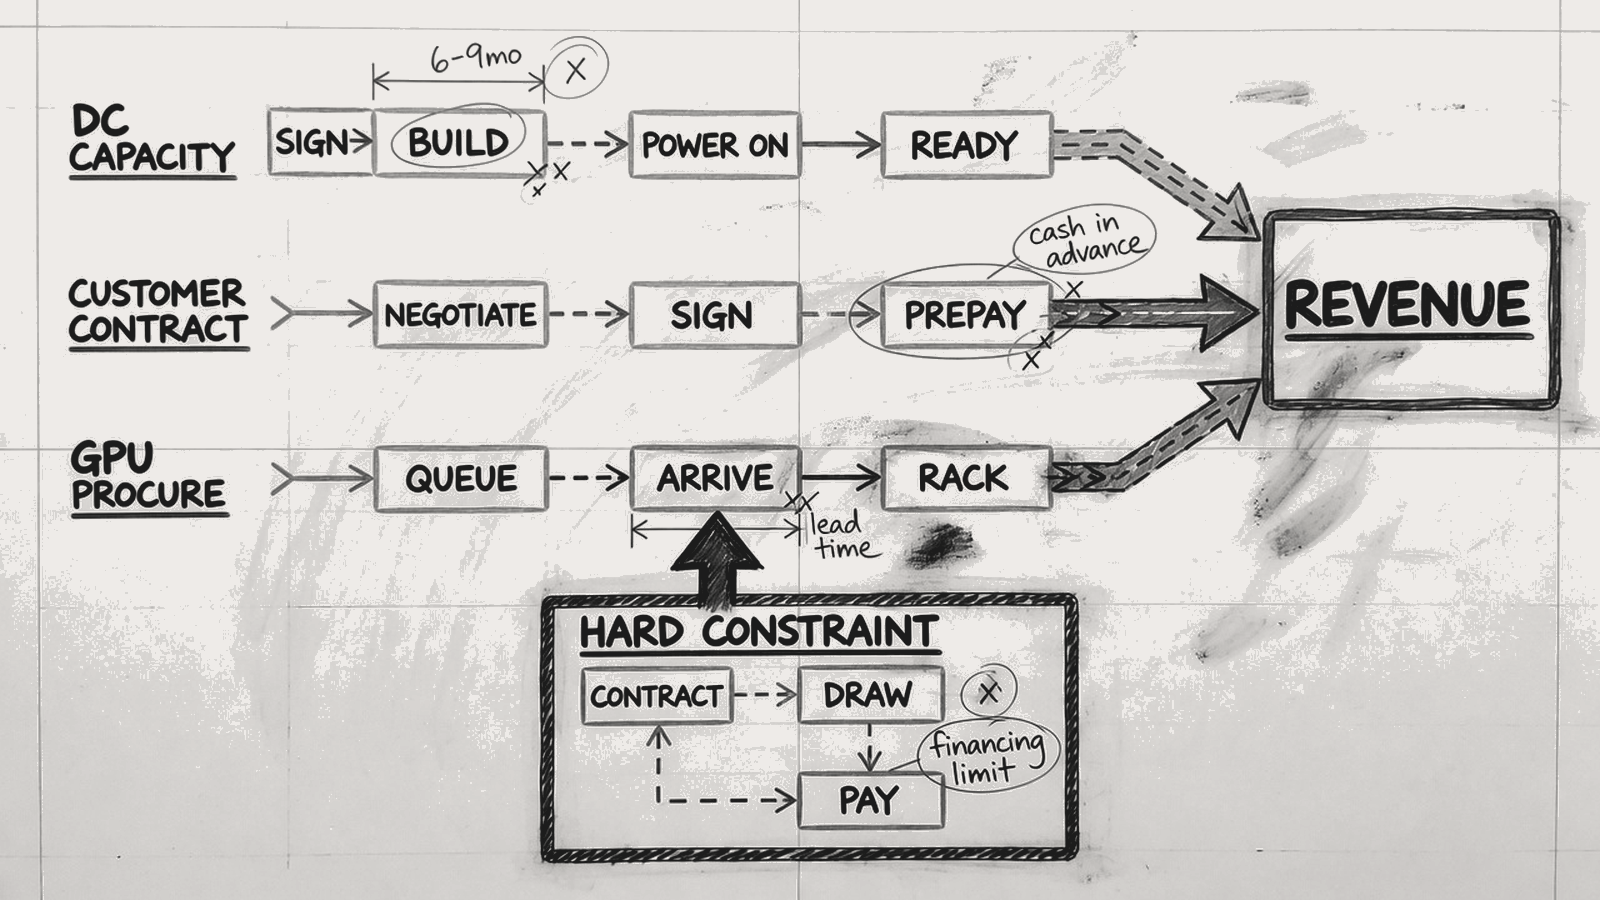
Figure 2.0. Three parallel pipelines (data-center capacity, customer contracts, GPU procurement) meet at revenue recognition; the hard constraint is customer contract → DDTL draw → GPU payment.
The flywheel’s core risk: cost is clock-driven (DC rent monthly, interest quarterly), revenue is event-driven (starts only when all three pipelines land). The larger the timing gap between pipelines, the longer the window of “cost running, revenue not yet open.” Microsoft’s March 2025 partial service cancellation over delivery delays is an instance of Pipeline A (DC energization lag) dragging the entire revenue-recognition chain.
2.1 Data-Center Resources
In aggregate, CoreWeave owns zero real estate. Every data center is leased or colo. It installs its own GPUs, networking, and cooling inside someone else’s building—owner of the GPU hardware, tenant of the facility.
2.1.1 Partnership modes and key partners
CoreWeave’s data-center partnerships fall into three modes:
| Mode | Description | CoreWeave bears | Landlord bears |
|---|---|---|---|
| Powered Shell | Landlord provides building shell + power interconnect + base cooling | GPU + network + custom cooling + ops | Building + power bring-up + base MEP |
| Colocation | Traditional colo: landlord provides racks/power/cooling/security | GPU + network | Racks + power + cooling + security |
| Build-to-Suit / JV | Custom build, long-term lease. Only Kenilworth to date | 15% equity + $95M guarantee + $200M construction | 85% equity + construction principal |
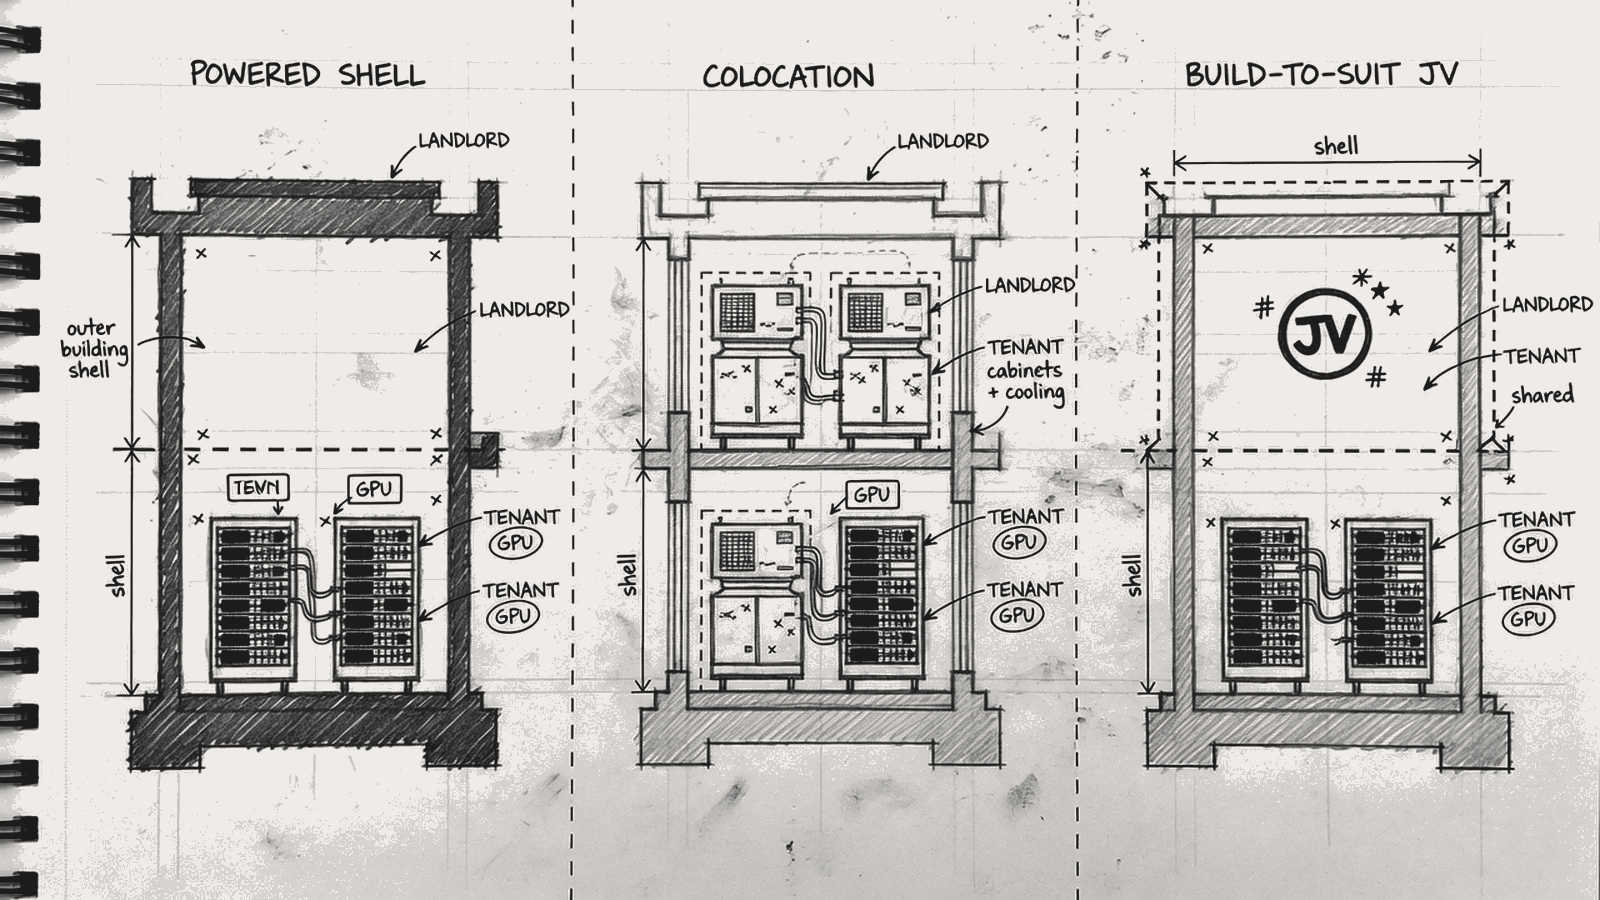
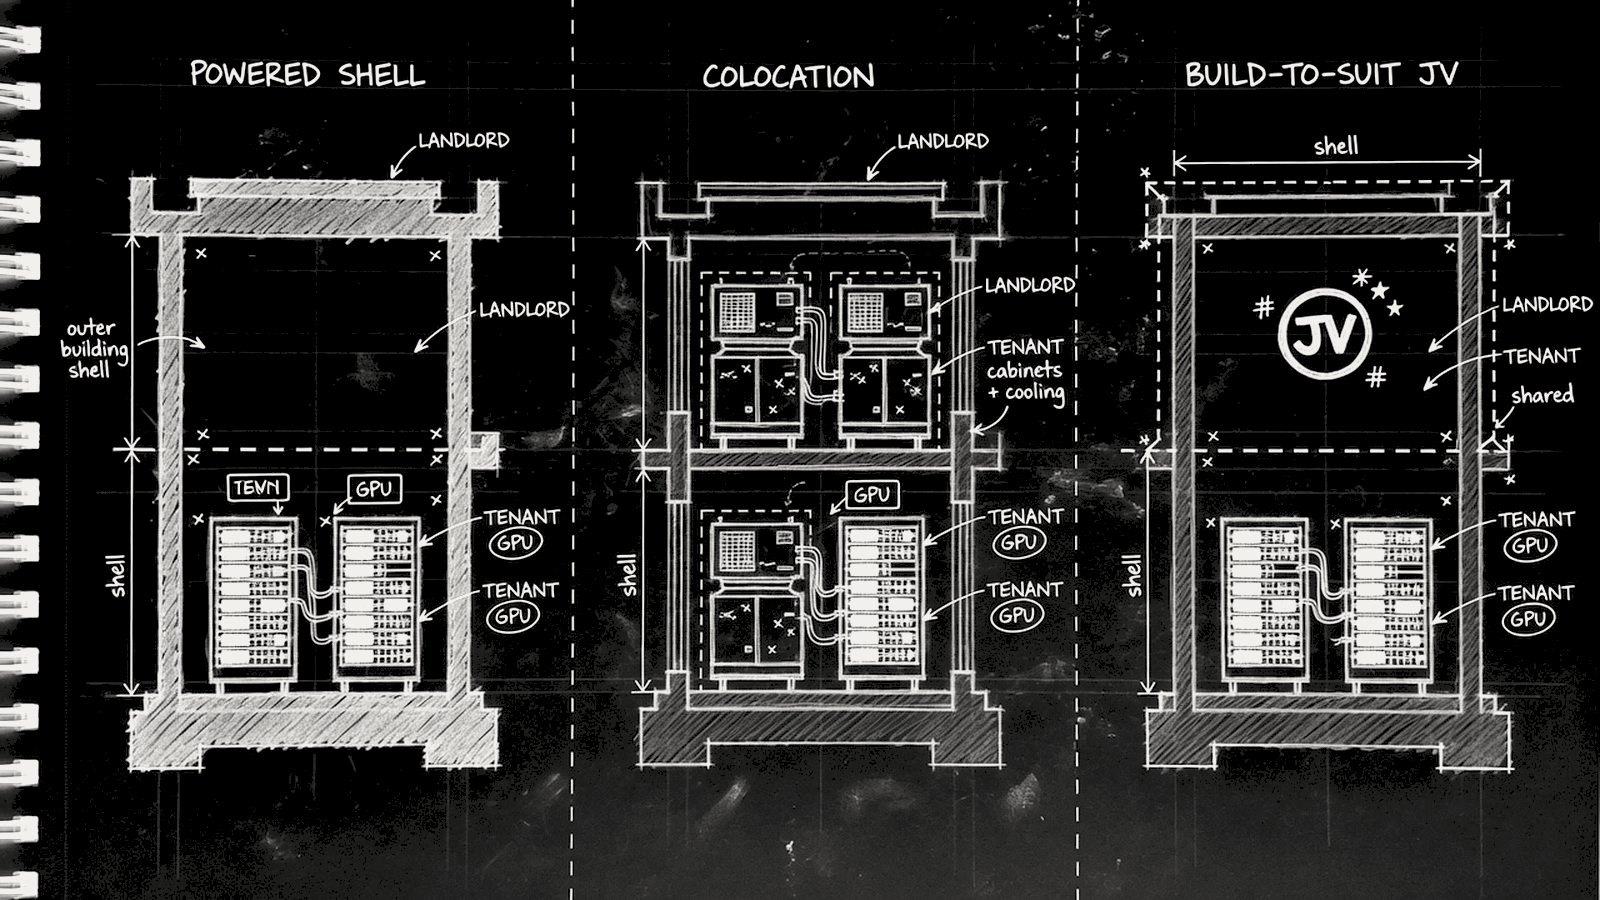
Figure 2.1.1. Three data-center partnership modes: Powered Shell, Colocation, and Build-to-Suit / JV — who owns the shell versus the GPU stack.
Known major partnerships and contract scale:
| Partner | Capacity | Term | Contract scale |
|---|---|---|---|
| Applied Digital | 250 MW (+150 MW expansion) | ~15 years | ~$7B total revenue |
| Core Scientific | 16 MW (Austin) + Muskogee | 8–12 years | $3.5B/12yr (~$290M/yr) |
| Galaxy/Helios | — | 15 years | >$1B/yr at full run-rate |
| Digital Realty | 36 MW | — | — |
| TierPoint | 16 MW | Long-term | — |
| Kenilworth JV | 280K sqft | 15 years | $57M equity + $95M guarantee + $200M construction |
Other partners include Flexential (Hillsboro OR, Douglasville GA), EdgeConneX (new Cedar Creek TX campus), Switch (Las Vegas Core Campus), Related Digital (Wyoming), and others.
On selected projects CoreWeave is experimenting with a shift from pure tenant toward partial equity ownership. Kenilworth JV is the exemplar—CoreWeave’s only data-center project with equity (15%): the 280K sqft NEST11 site, with CoreWeave contributing $57M equity + a $95M completion guarantee + up to $200M construction funding, and a third-party developer holding the remaining 85%.
2.1.2 Capacity scale, cost, and monetization efficiency
| Metric | YE'23 | YE'24 | YE'25 | Q1'26 | Q2'26 |
|---|---|---|---|---|---|
| Active power | ~70 MW | ~360 MW | ~850 MW | >1 GW | 1.5 GW |
| Contracted power | — | — | >3.1 GW | >3.5 GW | 3.7 GW |
| Active/contracted | — | — | ~27% | ~29% | ~40% |
| Data centers | 10 | 32 | 43 | ~49 | 49+ |
Figure 2.1.2a. Active power expansion YE'23 → Q2'26. Contracted power (~3.7 GW) still leaves ~60% of signed capacity offline.
Q2 alone added ~500 MW of active power—the largest single-quarter capacity add to date. But the active/contracted ratio is only ~40%: 60% of contracted capacity is not yet live. In two years the footprint grew from 10 DCs to 49+, across 13 U.S. states and 6 countries (US/UK/Norway/Sweden/Spain/Canada).
CoreWeave does not disclose $/kWh power cost or site-level rent detail. Available cost signals:
| Basis | FY25 amount | ÷ avg ~600 MW | Implied $/kW/mo |
|---|---|---|---|
| Rent only (operating lease cost) | $825M | ~$1.38M/MW/yr | ~$115 |
| All-in (incl. CAM/power/security) | $1,131M | ~$1.89M/MW/yr | ~$157 |
Figure 2.1.2b. FY25 data-center cost signals ($/kW/month). All-in ~$157 vs industry ~$165; average MW estimated ~600 MW.
Industry all-in benchmark is roughly $165/kW/mo (secondary source). CoreWeave’s ~$157/kW/mo is roughly at market. Average MW is estimated (mean of YE24 360 MW and YE25 850 MW ≈ 600 MW); ±50 MW swings $/kW/mo by about ±$20.
| Path | Basis | Cost per MW | Meaning |
|---|---|---|---|
| Industry standard self-build | One-time capex (building + equipment) | $10–15M/MW | No rent after build |
| Efficient self-build (e.g. xAI) | Same | $2.7–8M/MW | Extreme optimization |
| CoreWeave lease | NPV of annual rent (~$1.89M/yr ÷ 9.5% cap rate) | ~$19.9M/MW | No building ownership, but rent NPV ≈ 1.5–2× self-build cost |
Figure 2.1.2c. Capex-equivalent cost per MW: industry self-build vs CoreWeave lease NPV (~$1.89M/yr ÷ 9.5% cap rate). Lease buys speed at a permanent margin drag.
$19.9M capitalizes annual rent at a 9.5% discount rate for like-for-like comparison with self-build. CoreWeave leases rather than builds to trade higher annualized cost for faster deployment. Growing from 10 DCs to 49 in two years would be impossible under self-build. The price is permanent margin drag.
What revenue does that cost buy? Revenue/MW measures capacity monetization:
| Period | Revenue (annualized) | Active MW | Rev/MW |
|---|---|---|---|
| Q1'26 | ~$8.3B | ~1,000 | ~$8.3M |
| Q2'26 | ~$10.3B | ~1,500 | ~$6.9M |
Figure 2.1.2d. Annualized Revenue/MW. Q2 decline reflects mid-quarter energization of ~500 MW of new capacity.
Q2 Rev/MW fell because ~500 MW of new capacity energized mid-quarter and did not contribute a full quarter of revenue. Industry-benchmark rent of $1.98M/MW/yr vs CoreWeave Rev/MW ~$6.9M means rent is only ~29% of Rev/MW—output per megawatt far exceeds lease cost.
2.1.3 Off-balance commitments and capacity gap
$47.3B of off-balance lease commitments—hidden rigid cost:
| Category | Amount | Time span |
|---|---|---|
| Signed but not-yet-commenced leases | $38.5B | Commence 2026–2029; 5–17 year terms |
| Of which: largest single site (393 MW) | $13.5–14.4B / 16 years | Phased delivery 2026–2027 |
| Post-YE25 additions | +$8.8B | — |
| Equipment install obligations | $1.1–1.7B | Through 2027 |
| Total off-balance obligations | ~$47.3B | — |
Figure 2.1.3a. Off-balance lease and install obligations (~$47.3B). These sit outside both interest-bearing debt and recognized lease liabilities until commencement.
These sit off the balance sheet—outside $35.1B of interest-bearing debt and outside $8.2B of operating-lease liabilities. Once they commence, they will transform the reported picture.
How were these $47.3B leases signed?
The 10-K does not disclose single-lease terms, but accounting policy, risk factors, and known contracts assemble a coherent picture.
Contract nature and payment. Legally these are non-cancelable operating leases—10-K Note 8 bases lease term on the “non-cancelable period of the lease.” Once signed, they cannot be cancelled. Payments are largely fixed monthly (10-K: “primarily fixed”); some contracts include variable payments covering CAM (common-area maintenance), power pass-through, and security.
When payment starts. Monthly payments begin on the lease commencement date. Commencement = landlord delivery of usable capacity (energization). Before that, these leases are not recognized as lease liabilities and ROU assets—that is why $47.3B is off-balance. Once the landlord finishes construction and energizes, the obligations enter the balance sheet immediately, sharply increasing ROU assets and lease liabilities.
How rent is priced. Pricing varies by site. The largest single site (393 MW) is based on the landlord’s actual construction cost, with a contractual cap ($13.5–14.4B / 16 years)—meaning CoreWeave bears some landlord cost-overrun risk (within the cap). Another 378 MW tranche has construction-period payments that are variable and condition-dependent, finalized around commencement.
Prepayments and guarantees. The 10-K does not disclose a standard prepay ratio, but known data suggest it is typically required. Kenilworth JV has a $15M prepay; CoreWeave maintains $294M of letters of credit (LOC), and Note 9 states their primary purpose is to “guarantee the Company's ability to fulfill its lease obligations”—landlord-required performance security. Industry practice for powered shell usually requires 6–12 months of rent as security deposit or equivalent LOC.
Early termination? Almost never. Accounting policy excludes termination options CoreWeave is “reasonably certain not to exercise,” meaning management does not expect to exercise early exits—these are non-cancelable long-term obligations.
What if customers do not arrive and capacity idles? The 10-K does not disclose specific liquidated-damages clauses, but Risk Factors language is direct: if customer default leaves capacity idle, CoreWeave “remain[s] responsible for expenditures for components, infrastructure, and data center leases and build-outs, as well as related financing that we have undertaken for which we may not receive corresponding revenue”—rent is still due even without customer revenue. More notable still: CoreWeave states “We do not currently maintain credit insurance to insure against customer credit risk”—no external insurance hedges this risk.
On-book lease maturity schedule (undiscounted, commenced leases):
| Year | Operating leases |
|---|---|
| 2026 | $1,180M |
| 2027 | $1,233M |
| 2028–2029 | Increasing |
| Thereafter | $7,492M |
| Undiscounted total | $13,614M |
| Present value | $8,195M |
Weighted average remaining term: operating leases ~11 years, finance leases ~5 years. Discount rate ~10%.
Figure 2.1.3b. Undiscounted operating-lease cash schedule already on books (PV $8.2B). Weighted remaining term ~11 years.
Q2 backlog $104.2B vs off-balance lease obligations $47.3B + on-book lease liabilities $8.2B means DC cost commitments already equal ~53% of backlog. If backlog conversion underperforms, lease obligations remain rigid—a mismatch of rigid cost versus elastic revenue.
How much data-center capacity does $104B of backlog require?
$104B of backlog against current ~$12.8B/year revenue looks like ~8× capacity. But backlog is not delivered all at once—it recognizes over ~8 years, front-loaded (see RPO maturity estimates in §2.2). Converting at Q2 annualized Rev/MW ~$6.9M:
| Year | Estimated recognized revenue (§3.2 estimate) | Required active power (@ $6.9M/MW) |
|---|---|---|
| FY2026 | ~$12.8B (guidance) | ~1.9 GW |
| FY2027 | ~$19–23B | ~2.8–3.3 GW (peak) |
| FY2028 | ~$19–21B | ~2.8–3.0 GW |
| FY2029+ | Declining | <2.5 GW |
Figure 2.1.3c. Implied active-power need to deliver $104B backlog at ~$6.9M Rev/MW. Peak demand ~2.8–3.3 GW in FY27; contracted capacity covers the ceiling, execution does not.
Capacity-gap quantification:
| Metric | Current (Q2'26) | FY27 peak demand | Gap |
|---|---|---|---|
| Active power | 1.5 GW | ~2.8–3.3 GW | ~1.3–1.8 GW still to go live |
| Contracted power | 3.7–4.2 GW | — | Ceiling is sufficient |
| Active / Contracted | ~40% | Needs ~70–80% | 30–40 percentage-point execution gap |
Contracted 3.7–4.2 GW covers peak demand on paper—the contracts are signed. The real bottleneck is not under-signing but the speed of converting contracted into active: grid interconnection (U.S. grid approvals are the largest physical constraint), substation build, liquid-cooling install, GPU rack-and-bring-up—each has physical time constraints that contracts cannot accelerate.
CoreWeave’s response is two-track: near-term, gradually energize the 60% of the existing 3.7–4.2 GW contracted still offline (YE26 target >1.85 GW, implying another +350 MW needed in H2); medium-term, bring the $47.3B off-balance leases into service in 2027–2029 (including the 393 MW single site + 378 MW additions, etc.). Q2 delivered 500 MW in one quarter (a record); if H2 holds that pace, YE26 could reach ~2.5 GW.
One peer reference is cautionary: Nebius also has >3.5 GW contracted, but YE25 active was only ~170 MW—contracted/active under 5%. The gulf between signed capacity and live capacity is a systemic NeoCloud risk, not CoreWeave-specific. CoreWeave’s 40% conversion is best-in-class among peers, but still far from the 70–80% needed for peak demand.
Rev/MW is also not static. Deploying GB300 on the same MW produces higher revenue than H100 (new-card pricing premium) but also higher power draw (fewer GPUs per MW). GPU generation transitions change both numerator and denominator of Rev/MW—future Rev/MW may rise (pricing) or fall (power density), depending on GPU mix and market pricing.
Conclusion: CoreWeave does not need 10× capacity, but it does need to roughly double active power to ~3 GW within 18 months. Contracted 4.2 GW provides ceiling headroom; $47.3B of off-balance leases is the future capacity pipeline. The real test is execution speed—no matter how large the backlog print, unenergized power does not count.
2.2 Customer Contract Revenue: What $104B of Backlog Is Really Worth
CoreWeave’s revenue engine has one motion: sign multi-year take-or-pay deals → deliver GPU clusters → recognize revenue ratably under ASC 606. ~98% of revenue comes from committed contracts; on-demand is under 2%. Every dollar of growth depends on new contract signings and capacity delivery—there is no platform organic growth. ~85% of FY25 revenue growth came from existing-customer expansion, only ~15% from new customers—the growth model is large-customer upsizing, not customer-count diffusion.
2.2.1 Backlog quality and contract terms
| Metric | YE'24 | YE'25 | Q1'26 | Q2'26 | Post-Q2 |
|---|---|---|---|---|---|
| Revenue backlog | — | $66.8B | $99.4B | $104.2B | +>$25B* |
| RPO (GAAP) | ~$15.1B | $60.7B | ~$98.8B | $103.7B | — |
*Note: Post-Q2 the company said early Q3 had an additional >$25B of net new commitments, explicitly not included in the $104.2B—the two should not be added naively.
Figure 2.2.1a. Revenue backlog YE'25 → Q2'26. RPO nearly matches backlog by Q2 ($103.7B), signaling delivery-condition gap compression.
What backlog is—and is not. Revenue backlog is a company-defined non-GAAP metric: RPO plus committed estimates that still require delivery of available capacity and similar conditions. It is not unconditional accounts receivable. At Q2 end, backlog $104.2B vs RPO $103.7B—a gap of only $0.5B—means nearly all backlog already meets GAAP RPO recognition conditions. Versus YE25’s $6.1B gap, compression signals improving delivery execution.
Backlog converts to revenue only if three conditions hold: (1) power can interconnect—active 1.5 GW vs contracted 3.7 GW, 60% of signed capacity offline; (2) GPU clusters deliver and rack on schedule; (3) customers exercise options or renew. Delay any link and backlog is paper.
Contract structure economics:
| Dimension | Mechanism | Implication |
|---|---|---|
| Take-or-pay | Fixed capacity / fixed fee whether used or not | Very high revenue certainty; but customers expect latest GPUs, creating generation-upgrade pressure |
| 1–6 year terms | New-sign weighted average ~5 years | Long lock = stable revenue + GPU depreciation amortization; but two GPU generations turn over in 5 years |
| Ratable recognition | ASC 606 service contracts, recognized evenly over term | Earn when delivered; earn nothing when not |
| 15–25% prepay | 15–25% of TCV at signing | Customer deposits YE25 $1.2B (YE24 only $49M, +24×) |
| 98% committed | FY23 88% → FY24 96% → FY25 98% | Almost no spot revenue. Growth is 100% new signing |
Four layers of contract protection—and their real force:
| Protection layer | Mechanism | Force assessment |
|---|---|---|
| Prepay lock-in | Customer has paid 15–25% of TCV | Medium—prepay not high enough to make default impossible |
| Take-or-pay obligation | No termination for convenience; default triggers acceleration | Strong—but enforcement depends on customer credit and jurisdiction |
| Late-payment interest | Unpaid amounts accrue at 1.5%/mo (18% annualized) | Medium—deterrent for AI startups; zero cost for Microsoft |
| Market supply/demand | When GPUs are scarce, customers have no exit motive | Currently strongest—but this is a market condition, not a contract term |
In March 2025 Microsoft cancelled part of CoreWeave’s services over delivery delays—proof that top customers have real bargaining power when delivery misses. CoreWeave cannot realistically sue a customer that is 67% of its revenue. Contracts include delivery/availability conditions; if CoreWeave fails to deliver capacity on time, customers may have rights not to pay or to terminate. True protection is not legal language; it is a GPU-scarce market. If that premise flips, customers have motive to renegotiate or exit.
Prepayments and deferred revenue—the hardest slice of backlog:
| Metric | Data |
|---|---|
| Signing prepay share | 15–25% of TCV |
| YE25 Customer deposits | $1,177M (YE24 only $49M, +24×) |
| YE25 Deferred revenue | $8,185M (1.6× FY25 revenue) |
| Allowance / AR | $4M / $685M = 0.6% |
Figure 2.2.1b. YE25 customer deposits and deferred revenue — the hardest slice of backlog credit quality.
Deferred revenue $8.2B + deposits $1.2B = $9.4B of cash/obligation already in hand—the hardest credit slice of backlog. Credit-risk distribution: >70% of backlog is investment-grade / hyperscaler customers with very low default probability. True credit risk sits in the <30% AI-native tail. CoreWeave maintains no credit insurance.
2.2.2 Revenue recognition and forward estimates
YE25 RPO $60.7B maturity distribution (10-K disclosure):
| Time window | Share | ~Amount |
|---|---|---|
| Within 24 months (through 2027-12) | 43% | ~$26.1B |
| Months 25–48 | 38% | ~$23.1B |
| Months 49–84 | 19% | ~$11.5B |
After Q1'26 RPO rose to $98.8B, the 24-month conversion share fell to 36% (vs YE25 43%)—because Q1 signed many 5–7 year contracts that diluted near-term share. Longer contracts smooth annual recognition but raise GPU generation-mismatch risk.
Estimated annual recognition cadence on $104B backlog (research estimate):
| Year | Share est. | ~Recognized amount | Logic |
|---|---|---|---|
| FY2026 | ~12–13% | ~$12.4–13.2B | = FY26 revenue guidance |
| FY2027 | ~18–22% | ~$19–23B | 24-month window minus FY26 |
| FY2028 | ~18–20% | ~$19–21B | First half of months 25–48 |
| FY2029 | ~16–18% | ~$17–19B | Second half of months 25–48 |
| FY2030+ | ~19% | ~$20B | Beyond 4 years |
Figure 2.2.2. Research estimate of $104B backlog recognition cadence. FY26 guidance consumes only ~12%; delivery chain, not signature count, gates conversion.
FY26 revenue guidance consumes only ~12% of backlog—existing backlog could theoretically support ~8 years of revenue. Between “theory” and “practice” sits the full delivery chain (grid interconnect → GPU arrival → cluster rack → customer acceptance). No matter how large the backlog, undelivered capacity does not recognize as revenue.
Accounting classification risk: CoreWeave classifies all revenue as ASC 606 service contracts (not ASC 842 leases) because customers “do not control the underlying hardware.” Deloitte marked this a Critical Audit Matter. BRUN, which also rents bare-metal GPUs, recognizes under ASC 842 lease—same business shape, opposite accounting classification (see §3.1 five-layer product spectrum), so cross-company margin comparison fails.
2.2.3 Customer concentration
| Period | Customer A (Microsoft) | Customer B | Customer D | Top2 |
|---|---|---|---|---|
| FY2023 | 35% | 17% | <10% | 56% |
| FY2024 | 62% | 15% | <10% | 77% |
| FY2025 | 67% | <10% | <10% | — |
| Q1'26 | 45% | 20% | — | 65% |
Figure 2.2.3. Customer concentration: Microsoft share peaks at 67% in FY25, eases to 45% in Q1'26 as other named contracts begin recognizing.
Microsoft rose from 35% of FY23 revenue to 67% of FY25 (absolute ~$80M → ~$3.4B). The Q1'26 drop to 45% reflects OpenAI/Meta and other contracts beginning to recognize, but top-2 still holds 65%. The 10-K notes letter codes may represent different customers across periods. Customer D is a new FY25 AR >10% customer—possibly OpenAI or Meta based on contract-signing timing.
Five named strategic contracts (public scale; some are cumulative caps):
| Customer | Public scale | Meaning |
|---|---|---|
| Microsoft | Historic cornerstone | FY25 contribution ~$3.4B (~67%); CoreWeave is effectively MSFT’s GPU overflow supplier |
| OpenAI | ~$22.4B cumulative | Largest single contract customer; but OpenAI itself is loss-making—credit depends on Microsoft backstop |
| Meta | ~$35B cumulative | Second-largest contract mass (2025 ~$14.2B + 2026 add ~$21B) |
| Anthropic | Multi-year | Scale not fully disclosed |
| Jane Street | ~$6B contract + $1B equity | Financial customer; equity aligns interests |
The five named customers’ nominal contracts sum to >$70B—about two-thirds of the $104B backlog. If Microsoft reduces external procurement in the next contract cycle (self-build catching up or Maia custom silicon maturing), CoreWeave loses not one customer but the bulk of revenue. Q1'26’s 45% is better than FY25’s 67%, but Microsoft remains the single largest variable.
2.3 Financing Channels and Capital Structure: From Pawnshop Rates to Eurobonds
CoreWeave’s financing evolution is itself evidence that the NeoCloud model has been progressively accepted by traditional finance—from Blackstone’s 2023 GPU-collateral high-cost debt (effective rate ~15%) to 2026 Eurobond + unsecured public syndicates, the credit curve moved in three years from “junk-grade GPU pawnshop” to “near-investment-grade public bond market.”
| Metric | YE'23 | YE'24 | YE'25 | Q1'26 | Q2'26 |
|---|---|---|---|---|---|
| Cash | $217M | $1,361M | $3,127M | $2,244M | $5,524M |
| PP&E net | $3,946M | $11,915M | $30,557M | $36,424M | $46,736M |
| Total debt | ~$2,000M | $7,926M | $21,373M | $24,859M | ~$35,100M |
| Net debt | ~$1.8B | ~$6.6B | ~$18.2B | ~$22.6B | ~$29.6B |
Debt grew ~17× in two and a half years. The financing model passed through three stages: (1) 2023: GPU-collateral ABL (Blackstone/Magnetar, 15%); (2) 2024–2025: contract-backed term loans (SOFR+2.25–4.00%); (3) 2026: unsecured notes + Eurobond + public syndicate. Research estimate of blended cost of debt: ~$640M × 4 / $35.1B ≈ ~7.3% annualized.
Figure 2.3. Total debt YE'23 → Q2'26 (~17× in 2.5 years). Cash $5.5B and PP&E net $46.7B at Q2'26.
2.3.1 Full credit facilities
Below are all debt instruments disclosed in 10-K Note 10, with full terms (data through YE25; Q2'26 new facilities noted separately):
| Facility | Signed | Rate | Capacity | YE25 balance | Maturity | Amortization | Collateral |
|---|---|---|---|---|---|---|---|
| DDTL 1.0 | 2023-07 | 15% eff. | $2.3B | $1,553M | 2028-03 | Quarterly amort. | GPU servers + sub equity + substantially all sub assets |
| DDTL 2.0 | 2024-05 | 10% (SOFR+spread) | $7.6B | $5,037M | 5 years post-draw | Quarterly amort. (from 2026-01) | Same |
| DDTL 2.1 | 2025-09 | 9% (SOFR+4.25%) | $3.0B | $2,741M | 5 years post-draw | Quarterly amort. (from 2026-07) | Same (new tranche under 2.0 amendment) |
| DDTL 3.0 | 2025-07 | 9% (SOFR+4.00%) | $2.6B | $340M | 2030-08 | Monthly amort. (from 2026-04) | Same |
| DDTL 4.0 | 2026-03 | SOFR+2.25% / ~5.9% fixed | $8.5B | — | 2032-03 | — | GPU + Meta customer contract into standalone SPV (non-recourse); A3 / A(low) investment grade |
| DDTL 5.0 | 2026-05 | SOFR+4.50% | $3.1B | — | ~5.5 years | — | Borrower all-assets + 100% equity pledge; DSCR ≥1.35×; Ba2 / BB+; first public syndicate |
| DDTL 5.5 | 2026-08 | SOFR+5.50% | $2.6B | — | ~5 years | — | All-assets + parent guarantee; Ba2 / BB+; customer contracts avg ~3 years vs loan ~5 years |
| 2030 Senior Notes | 2025-05 | 9.25% coupon | $2,000M | $2,000M | 2030-06 | Bullet at maturity | Unsecured |
| 2031 Senior Notes | 2025-07 | 9.00% coupon | $1,750M | $1,750M | 2031-02 | Bullet at maturity | Unsecured |
| 2031 Convertible | 2025-12 | 1.75% coupon | $2,588M | $2,588M | 2031-12 | Maturity or conversion | Unsecured |
| Revolving Credit | 2024-06 (multiple amendments) | 6% | $2.5B | $1,000M | 2029-11 | Revolving | Certain asset pledges |
| OEM Financing | Multiple | 10% | $4.8B | $3,800M | 2026–2030 | Amort. (1–3 years) | Equipment secured |
| Software Financing | 2025-10 | Included in OEM | $431M | $368M | <5 years | Amort. | — |
| Magnetar Loan | 2024-08 | 12% | — | $273M | 2029-01 | Special (see below) | in-substance debt |
| Convertible Promissory | Acquisition-related | 7% | $172M | $168M | 2026-04 | Maturity/conversion | — |
| >$10B new (Q2) | Q2'26 | — | >$10B | — | — | — | Includes first Eurobond |
DDTL series—evolution of collateral structure
From DDTL 1.0 to 5.5, collateral structure evolved significantly—not from “GPU collateral” to “contract collateral,” but with both always present and increasingly refined:
Stage one: DDTL 1.0–3.0 (2023–2025)—GPU + all-asset security + unconditional parent guarantee
10-K Note 10 terms apply to all early DDTLs:
- Borrowing capacity tied to GPU depreciable cost. 10-K: “total loans available are constrained by the purchase price of assets... based upon the depreciable cost of GPU servers”—older GPUs, more depreciation, less borrowable amount.
- Collateral = substantially all subsidiary assets. Sub equity pledge + substantially all sub assets (not just GPUs).
- Unconditional parent guarantee (full recourse). Sub default is CoreWeave, Inc. liability.
- Mandatory prepayment triggers: default, change of control, certain asset dispositions, incremental debt.
- Restricted cash requirements: maintain restricted cash balances (as a share of draws)—primary source of YE25 $1,277M restricted cash.
- DDTL 3.0 special term: interest-rate swaps covering ≥75% notional within 45 days.
Credit logic in this stage: lenders (Blackstone/Magnetar) underwrote both GPU hardware value and CoreWeave corporate credit. Rates of 9–15% reflected high risk.
Stage two: DDTL 4.0 (2026-03)—structural innovation toward project finance
DDTL 4.0 is a fundamental structural shift: GPU hardware and a specific customer contract (Meta $14.2B) are packaged into a standalone SPV (CoreWeave Compute Acquisition Co. VIII, LLC), achieving non-recourse—default reaches only that SPV, not the parent.
Lenders now underwrite not CoreWeave’s credit but Meta’s payment certainty—investment-grade customer contract + GPU hardware = A3 / A(low) investment-grade rating. Rate fell to SOFR+2.25% (vs DDTL 1.0’s 15%)—~10 percentage points of credit-cost reduction.
10-K MD&A confirms: “DDTLs that are collateralized by contractual cash flows and infrastructure assets”—dual collateral of contract cash flows and infrastructure assets.
Stage three: DDTL 5.0/5.5 (2026-05/08)—return to all-asset security, open public markets
DDTL 5.0 and 5.5 did not continue 4.0’s non-recourse SPV model; they returned to all-asset security + parent guarantee. Rating Ba2/BB+ (not investment grade)—no single investment-grade mega-contract locked in. Innovation instead: first public syndicate issuance (DDTL 5.0) and secondary-market tradability—opening a new investor base.
DDTL collateral evolution summary:
| Stage | Facility | Collateral mode | Recourse | Rate | Rating |
|---|---|---|---|---|---|
| Stage one | 1.0–3.0 | GPU + all-assets + parent guarantee | Full recourse | 9–15% | None |
| Stage two | 4.0 | GPU + Meta contract → standalone SPV | Non-recourse | SOFR+2.25% | A3 (investment grade) |
| Stage three | 5.0/5.5 | All-assets + parent guarantee | Full recourse | SOFR+4.50–5.50% | Ba2/BB+ |
Key insight: CoreWeave is running both financing modes in parallel—“project finance” (DDTL 4.0, non-recourse, locked investment-grade customer contract, lowest rate) and “corporate finance” (DDTL 5.0/5.5, full recourse, whole-company credit, higher rate). Which mode is available depends on whether an investment-grade mega-contract can be packaged into an SPV.
Senior Notes—unsecured credit step-up:
The 2030 and 2031 Senior Notes are CoreWeave’s first unsecured bonds—no GPU collateral, pure corporate credit. That marks a credit step from “GPU pawnshop” to “quasi-investment-grade issuer.” 144A private placement (2030) + 144A + Reg S (2031) = access to international bond markets. Notes are callable under indenture terms with standard events of default. YE25 fair value $3.5B (vs book $3.75B).
2031 Convertible—precision dilution and hedge design:
- Conversion price $107.80/sh (9.2764 sh/$1K)—near current share price ~$105
- Not redeemable before 2028-12-05; thereafter redemption if price > 130% × $107.80 = $140.14 for 20 of 30 trading days
- Capped Calls: cost $340M, strike $107.80 / cap $215.60—hedges conversion dilution between $107.80–$215.60. Above $215.60 dilution is fully exposed
- Convertible only under specified conditions before 2031-09-01; freely thereafter
Magnetar Loan—the most unusual “debt”:
This $273M was not originally a loan—it was MagAI Ventures’ (Magnetar affiliate) $230M refundable prepaid capacity deposit (AI Computing Service Reserved Capacity Agreement). CoreWeave committed reserved compute for Magnetar portfolio companies. After a February 2025 amendment, either party may terminate for convenience, with unconsumed amounts refunded plus a 12%/year return. The company reclassified it as in-substance debt (ASC 470): $273M = $230M deposit + $43M redemption premium.
Revolving Credit—liquidity buffer:
Started at $650M in June 2024, expanded via three amendments to $2.5B (Nov 2025), maturity extended to Nov 2029. Includes a $600M LC sub-facility ($294M already used for lease guarantees). YE25 drawn $1.0B, $1.2B remaining available. Undrawn fee 0.25%/year. This is CoreWeave’s only short-term liquidity source.
Figure 2.3.1. Financing evolution: GPU pawnshop rates → contract-backed term loans → investment-grade SPV → unsecured notes and Eurobond.
2.3.2 Debt-burden analysis
Interest-burden trajectory:
FY23 $28M (12% of rev) → FY24 $361M (19%) → FY25 $1,229M (24%) → Q2'26 $640M (25%). Q3 interest guidance $860–940M—single-quarter interest expense approaching $1B. Of every $4 of revenue, $1 goes to creditors.
FY25 interest exact split (10-K):
| Component | Amount |
|---|---|
| Contractual interest | $1,220M |
| Discount / issuance-cost amortization | $110M |
| Less: capitalized interest | ($182M) |
| Debt interest subtotal | $1,148M |
| Finance-lease interest | $20M |
| Other | $61M |
| P&L interest expense total | $1,229M |
| Actual cash interest paid | $869M |
Capitalized interest of $182M is rolled into PP&E cost—P&L interest of $1,229M understates true cash interest burden. Rate sensitivity: 100 bps move ≈ ~$107M impact. Rate hedging is severely insufficient: $4.0B of swaps cover only ~30% of $13B+ floating-rate debt, weighted fixed SOFR ~3.90%—most floating exposure is naked.
Debt maturity schedule (YE25 face):
| Year | Maturing amount | Share |
|---|---|---|
| 2026 | $6,708M | 31% |
| 2027 | $4,298M | 20% |
| 2028 | $2,393M | 11% |
| 2029 | $1,769M | 8% |
| 2030 | $2,109M | 10% |
| Thereafter | $4,338M | 20% |
| Total | $21,615M | 100% |
2026–2028 maturities total $13.4B (62%)—the nearest maturity wall has been addressed via DDTL 4.0/5.0 and new notes, but the essence is refinancing old debt with new debt—total debt ballooned from $21.4B to $35.1B.
Broad obligations panorama (~$87B total obligations):
| Obligation type | Amount | On/off balance sheet |
|---|---|---|
| Interest-bearing debt (face) | $21.6B | On |
| Operating/finance lease liabilities | $8.4B | On |
| Not-yet-commenced lease commitments | $47.3B | Off |
| Non-cancelable purchase commitments | $7.9B | Off |
| Equipment install obligations | $1.1–1.7B | Off |
| Total | ~$87B | — |
~$87B of obligations vs $104B of backlog = cost obligations equal 84% of backlog. Room left for profit is extremely narrow.
2.3.3 Equity structure and selling-pressure analysis
Shares outstanding (YE25):
| Class | Issued | Voting |
|---|---|---|
| Class A | 394M outstanding | 1 vote/share |
| Class B | 108M outstanding | 10 votes/share |
| Treasury | 7M (cost $34M) | — |
| Total outstanding | 502M | — |
Three founders control ~73.6% of voting power with ~18% economic ownership (Class B 10 votes/share). Class B auto-converts to Class A no later than 2032-05-31. Via an Equity Exchange Agreement, founders can convert exercised Class A into Class B—economic sell-down without loss of voting control.
Potential dilution sources (92M shares = 18% of current outstanding):
| Source | Potential new shares | Trigger / strike |
|---|---|---|
| 2031 Convertible | ~24M shares | Price > $107.80 (capped $215.60) |
| Stock options | 34M shares | Avg $1.76; 25M exercisable @ $1.18 |
| RSU/RSA | 28M shares | Vesting; unrecognized SBC $1.3B / ~3 years |
| Warrants | 4M shares | Various terms |
| Total | ~92M shares | ~18% of 502M outstanding |
25M exercisable options at $1.18 strike have intrinsic value of $2.4B at ~$105/sh—a continuous sell motive and pressure source.
Insider selling scale: founders have sold >$2.3B; Magnetar has sold >$5.5B (still holds ~68M shares); NVIDIA has no sale record (47.2M shares, strategic hold).
Magnetar Capital is a multi-strategy hedge fund founded in 2005 in Evanston, Illinois (AUM ~$18.6B), by Alec Litowitz (ex-Citadel) and Ross Laser. The firm is known for the 2008 “Magnetar Trade”—long CDO equity while buying CDS against senior tranches—investigated by ProPublica in a Pulitzer-winning series. Litowitz retired in 2022; the firm is now co-managed by David Snyderman and Ross Laser.
Magnetar’s CoreWeave investment is the fund’s largest single-name exposure in history—at peak, 72% of its $20.5B portfolio. This is not ordinary hedge-fund positioning; it is a highly concentrated directional bet.
Full investment timeline (10-K Note 14 + public-source cross-check):
| Date | Event | Amount | Instrument |
|---|---|---|---|
| 2021-10 | Initial investment | — | 2021 Convertible Senior Secured Notes + $15M share-purchase option (IPO price $40/sh) |
| 2021-11 | Public announcement | $50M | Press release (Galaxy Digital as advisor) |
| 2022-10 to 2023-04 | Second round | $125M | 2022 Senior Secured Notes + 12M warrants (fully redeemed July 2024 for $137M) |
| 2023-04 to 2024-05 | Preferred participation | Not separately disclosed | Redeemable Convertible Preferred Stock (all converted at IPO) |
| 2023-08 | DDTL 1.0 co-lead | Part of $2.3B | GPU-secured debt (YE24 hold $438M) |
| 2023-12 | Tender offer | — | Bought employee/shareholder stock (buyer in 41M-share transfers) |
| 2024-05 | DDTL 2.0 co-lead | Part of $7.6B | GPU-secured debt (YE24 hold $106M) |
| 2024-06 | CoreWeave reverse investment | — | CoreWeave invested $50M into a Magnetar-managed fund |
| 2024-08 | MagAI capacity agreement | $230M deposit | Prepaid compute → 12%/yr in-substance debt |
| 2024-10 | Second tender offer | — | Again a buyer participant |
| 2025-03 | IPO | — | Notes/preferred all converted to Class A; left the board, voting <10%, exited related-party status |
| 2025-09-30 | Peak position | 91.4M shares | ~23% of Class A, market value $12.5B = 72% of Magnetar total portfolio |
| 2025–2026 | Ongoing sell-down | Sold >$5.5B | Holdings from 91.4M to 67.97M (13G/A 2026-05) |
Figure 2.3.3. Magnetar timeline: seed convertibles → peak Class A concentration (72% of fund AUM) → continuous sell-down after related-party exit.
Return magnitude: initial ~$50M convertible notes → equity at IPO → peak position $12.5B = ~250× book return (excluding intermediate adds). Even counting sold >$5.5B + current hold ~$7.1B = realized + unrealized ~$12.6B, this remains one of the most successful single investments in hedge-fund history.
Why Magnetar is the largest selling-pressure source: Magnetar is a hedge fund (not a strategic holder) with no long-hold obligation. Leaving the board and related-party status in March 2025 bought more flexible sell-down freedom—related parties face legal and window restrictions on sales. At the current pace (91.4M → 68M in six months ≈ ~4M shares/month), Magnetar could fall below 5% ownership in 12–18 months—each block sale is short-term price pressure.
Relationship complexity worth noting: Magnetar is simultaneously shareholder, creditor (DDTL 1.0/2.0), and compute customer (MagAI $230M capacity agreement), while CoreWeave reverse-invested $50M into a Magnetar-managed fund. Four roles coexist; related-party exit in March 2025 eased legal conflicts, but economic entanglement remains deep.
2.3.4 Reality of available cash
| Item | YE25 | Q2'26 |
|---|---|---|
| Reported cash | $3,127M | $5,524M |
| Less: restricted cash | ($1,277M) | TBD |
| Freely usable cash | ~$1,850M | est. ~$3–4B |
Restricted cash of $1.3B is mainly construction escrow + debt-service reserves—not available for day-to-day ops. Reported cash overstates true free liquidity. Stock repurchase authorization $500M (unused). Federal NOL $4.3B (indefinite)—a material tax shield when GAAP profitability arrives.
2.4 GPU Resources: The Largest Black Box
CoreWeave’s GPU fleet is the most information-opaque dimension in this research—unit counts by model, purchase prices by model, utilization, realized $/GPU-hr, residual values by model, and generation-level contract coverage are all unavailable.
2.4.1 GPU scale and models
Fleet-scale historical trajectory:
| Point in time | Estimated GPU count | Active Power | Source |
|---|---|---|---|
| YE2022 | >17,000 | ~tens of MW | Secondary (mining era, mostly A100) |
| YE2023 | ~53,000 | ~70 MW | Secondary (H100s ramping in) |
| YE2024 | ~250,000 | ~360 MW | S-1 / NextPlatform |
| YE2025 est. | ~600,000 | ~850 MW | NextPlatform estimate |
| Q2 2026 est. | 500,000–800,000 | 1.5 GW | Research estimate |
Figure 2.4.1. Estimated GPU fleet scale (secondary + research estimates). Model mix and $/GPU-hr remain the largest disclosure black boxes.
The fleet is Hopper-centric (H100/H200), with Blackwell (B200/GB200/GB300) ramping fast. CoreWeave was the first NeoCloud globally to deploy GB300 NVL72 (July 2025); Vera Rubin NVL72 is expected first-wave in H2 2026—new-card first-mover remains the hardest differentiation today. Networking uses NVIDIA Quantum-X800 800Gbps InfiniBand + Spectrum-X with RoCE; CPUs mix AMD and Intel.
Critical variables unavailable inside the black box:
| Desired data | Availability | Why it matters |
|---|---|---|
| Split by model (H100/H200/B200/GB300 counts) | Completely unavailable | Performance, pricing, and residual value differ drastically by model |
| Purchase price by model | Unavailable | Only FY25 total procurement $12.2B is known |
| Utilization (billable time / sellable time) | Unavailable | ~98% committed implies high utilization, unquantified |
| Realized $/GPU-hr | Unavailable | S-1 list H100 $49.24/hr; large-customer realized prices undisclosed |
$20.9B Technology equipment / ~600K estimated units ≈ ~$35,000/GPU average—but that mixes years and models (used H100s already ~$15–20K; GB300 still new-card high prices), so the average has limited analytical value.
2.4.2 Depreciation treatment
CoreWeave sets GPU (Technology equipment) useful life at 6 years—the most aggressive among peers (Nebius moved from 4 to 5 years). Effective GPU generation life is only 2–3 years (Hopper → Blackwell → Rubin); a 6-year assumption far exceeds technical generation life. H100s bought in 2023 depreciate through 2029—yet by 2026 H100 market prices have already fallen 60–75%.
PP&E detail (10-K Note 5, YE25 gross):
| Asset class | Useful life | YE25 Gross | Share |
|---|---|---|---|
| Technology equipment (GPU servers, switches) | 6 years | $20,903M | 62% |
| Software (capitalized, incl. internal-use) | 3–6 years | $802M | 2% |
| DC equipment & leasehold improvements | Shorter of lease term or 12 years | $2,842M | 8% |
| Construction in progress (CIP) | Not depreciated | $9,376M | 28% |
| Total gross PP&E | — | $33,941M | 100% |
Figure 2.4.2. YE25 gross PP&E mix. Technology equipment at 6-year life is 62%; CIP 28% has not yet entered the D&A run-rate.
Depreciation sensitivity—financial impact of 6-year vs 4-year assumptions:
| Assumption | Annual D&A | D&A/Rev | Delta |
|---|---|---|---|
| 6 years (CoreWeave actual) | ~$3.5B | ~48% | — |
| 4 years (conservative) | ~$5.2B | ~81% | +$1.7B/yr |
Under 4-year depreciation, Adj. Operating Income flips from positive to negative and GAAP net loss widens by $1.7B. The 6-year assumption improves reported optics without changing physical GPU life or secondary-market residual value. CIP $9.4B (28% of gross PP&E) has not yet begun depreciating—once placed in service, future D&A still has upside pressure. Capitalized interest $182M and capitalized SBC $59M are also embedded in PP&E cost.
2.4.3 NVIDIA relationship
CoreWeave’s relationship with NVIDIA is not a simple buy-sell contract; it is a three-layer binding structure:
| Layer | Mechanism | Meaning |
|---|---|---|
| Supply layer | No long-term price-lock contracts—depends on POs + short-term agreements + NVIDIA allocation | Supply rests entirely on relationship, not contractual guarantee |
| Capital layer | NVIDIA ownership ~10.55% ($2B @ $87.20/share); FY25 procurement $12.2B | Two-way economic alignment |
| Capacity put layer | $6.3B capacity repurchase agreement (through 2032)—NVIDIA commits to buy all unsold compute | Credit enhancement for lenders |
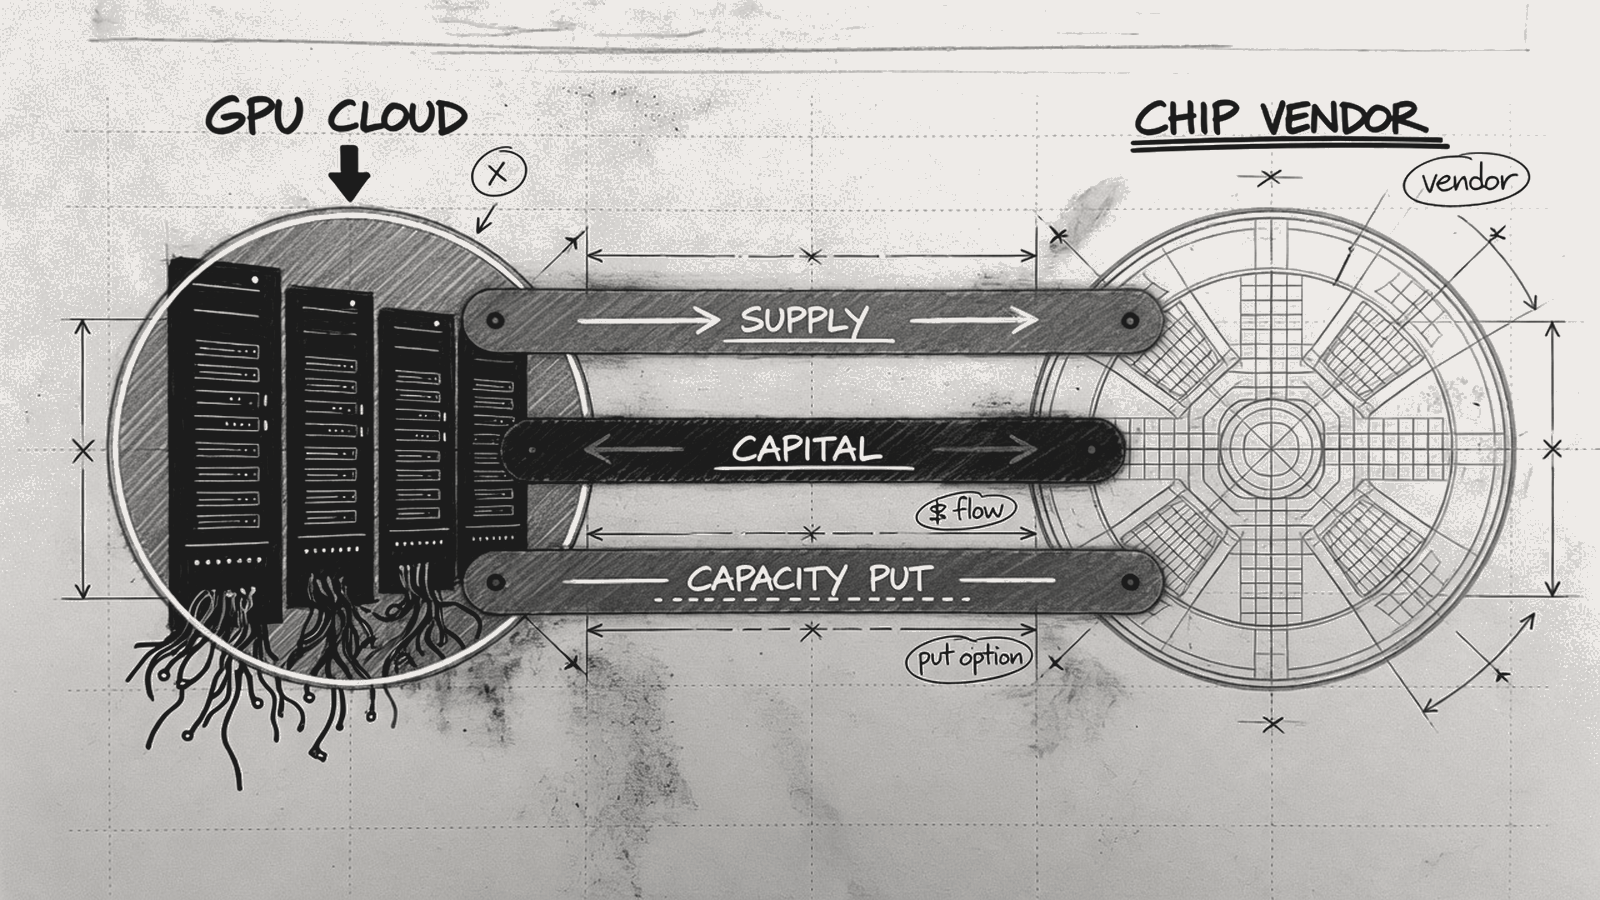
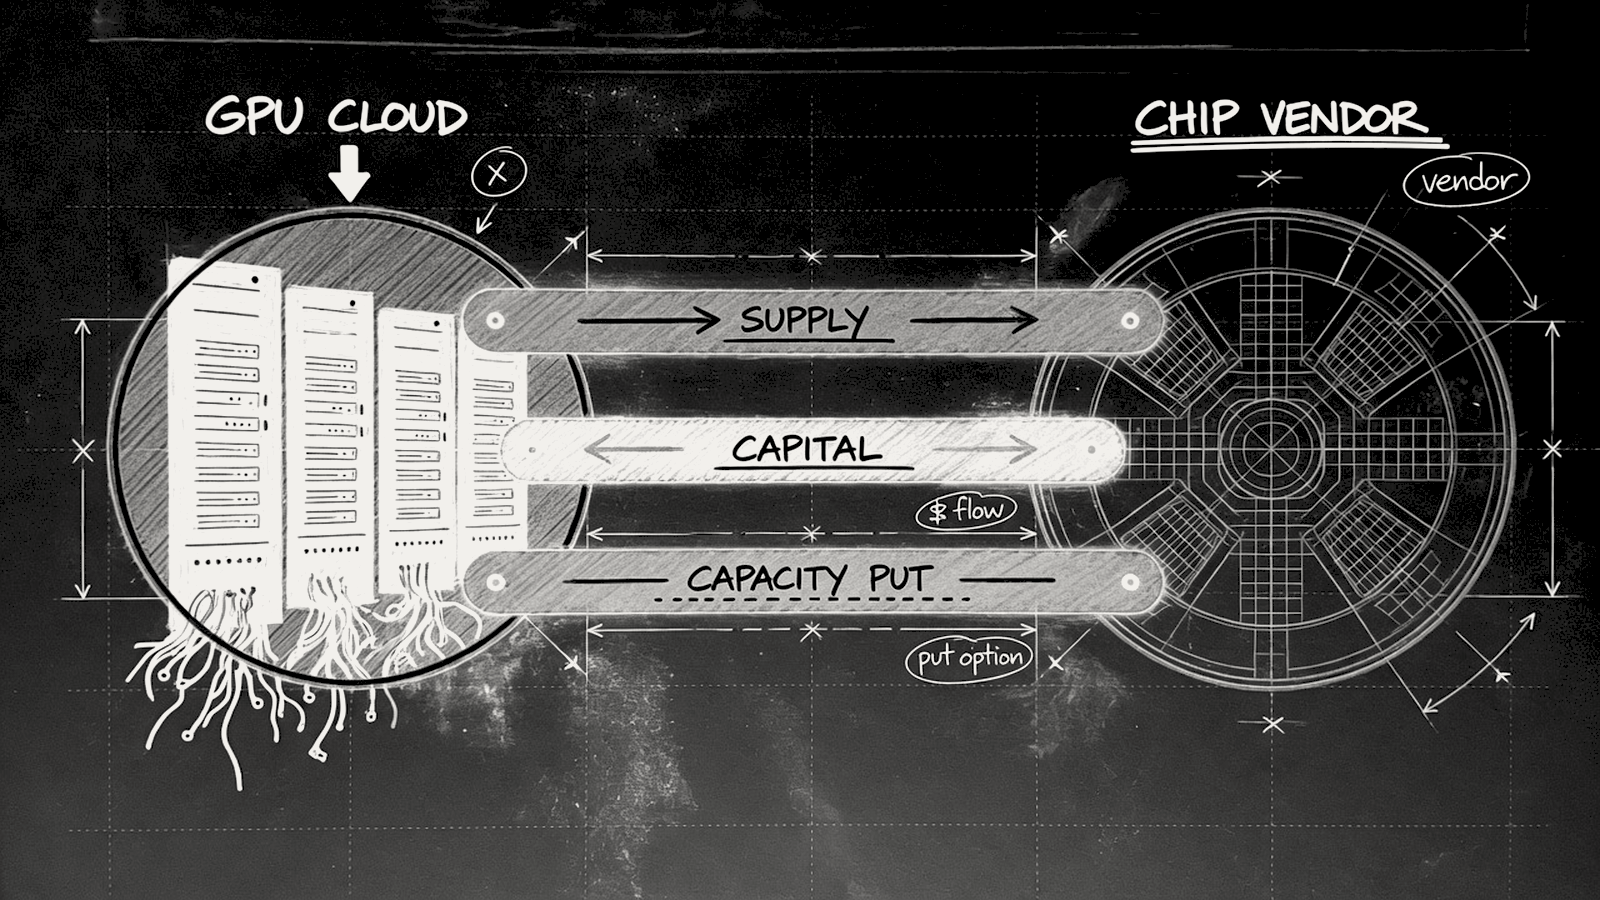
Figure 2.4.3. Three-layer NVIDIA binding: supply allocation, capital (~10.55% stake), and $6.3B capacity put — credit enhancement for lenders as much as commercial partnership.
Three-year NVIDIA related-party trend (10-K Related Party):
| Direction | FY2023 | FY2024 | FY2025 |
|---|---|---|---|
| CoreWeave → NVIDIA (GPU purchases) | $1.7B | $8.6B | $12.2B |
| NVIDIA → CoreWeave (buy compute) | — | — | $100M |
Three-year GPU procurement rose $1.7B → $12.2B (+618%); CoreWeave is already NVIDIA’s largest non-hyperscaler GPU buyer. $100M of reverse compute purchases is only ~2% of FY25 revenue—not a revenue pillar—but the multi-dimensional “NVIDIA invests + buys compute + sells GPUs + capacity put” linkage is the quantified basis for circular-trading skepticism in the market.
Meaning of the $6.3B capacity put: if CoreWeave GPU clusters cannot find customers, NVIDIA buys the capacity at agreed prices. For lenders (Blackstone et al.) this sharply reduces CoreWeave debt credit risk—even if customers default, NVIDIA backstops. For NVIDIA, it ensures CoreWeave can keep buying new GPUs—essentially NVIDIA credit-endorsing its largest non-hyperscaler sales channel.
Impact of NVIDIA AI Compute Partnership (July 2026) on CoreWeave:
In July 2026 NVIDIA launched AI Compute Partnership, batch-replicating the CoreWeave model (capacity put + revenue share + equity binding) to more NeoClouds—first partners Sharon AI (40K GPUs) and Firmus (170K GPUs, 360 MW) received similar terms.
| Horizon | Judgment | Logic |
|---|---|---|
| Near-term positive (1–2 years) | CoreWeave is the prototype and largest beneficiary | $6.3B put + $2B equity + Exemplar Cloud + GB300 first deploy—currently irreplaceable in the NVIDIA ecosystem |
| Medium/long-term risk (3–5 years) | GPU allocation is no longer scarce; pricing power compresses | More NeoClouds on equal terms = more GPU-hour supply = CoreWeave pricing premium hard to sustain |
NVIDIA’s role is shifting from “supplier” to “platform owner”—collecting hardware profit + cloud revenue share + equity appreciation simultaneously. NeoClouds in this structure degrade from “NVIDIA’s customers” to “operators on NVIDIA’s platform.” Of 15 global NVIDIA Exemplar Cloud certified providers, only four listed NeoClouds are certified: CRWV/NBIS/BRUN/IREN. CoreWeave holds GB300-generation certification—a precondition for new-card allocation priority.
In 3–5 years competitive advantage will shift from “can you get cards” to “once you have cards, can you operate more efficiently than peers.” CoreWeave’s response is climbing the software stack: Managed Inference ARR from ~$1M to >$100M, YE26 target $250M—still <2% of total revenue, but growing fast. The W&B acquisition ($1,029M) and Managed Inference are the two pillars of the shift from “bare-metal GPU rental” to “AI cloud platform” (see §3 business decomposition and M&A direction).
3. Business Decomposition, Financial Analysis, and M&A Direction
3.1 What CoreWeave Actually Sells: A Five-Layer Product Matrix
From the website and product docs, CoreWeave sells far more than “rent GPUs.” From the financials, almost all revenue sits in one fuzzy “AI cloud services” bucket. Understanding CoreWeave’s business essence requires placing what it sells on the GPU-compute delivery spectrum.
GPU compute delivery has five layers—from most “bare” to most “abstract”:
| Layer | Mode | What the customer sees | Typical example |
|---|---|---|---|
| 1 | Pure bare-metal lease | Physical servers, root access; customer installs OS/drivers/network | BRUN (ASC 842 lease) |
| 2 | Managed bare metal | Physical GPUs (no virtualization), running on vendor-managed K8s orchestration | CoreWeave CKS (core business) |
| 3 | Dedicated GPU cloud instances | Virtual instances; GPU dedicated but with hypervisor | AWS p5 / Azure ND |
| 4 | Shared GPU cloud instances | GPU partitioned via MIG/vGPU | Mid-tier cloud vendors |
| 5 | Serverless inference | API endpoint; customer never sees a GPU | CoreWeave Managed Inference |
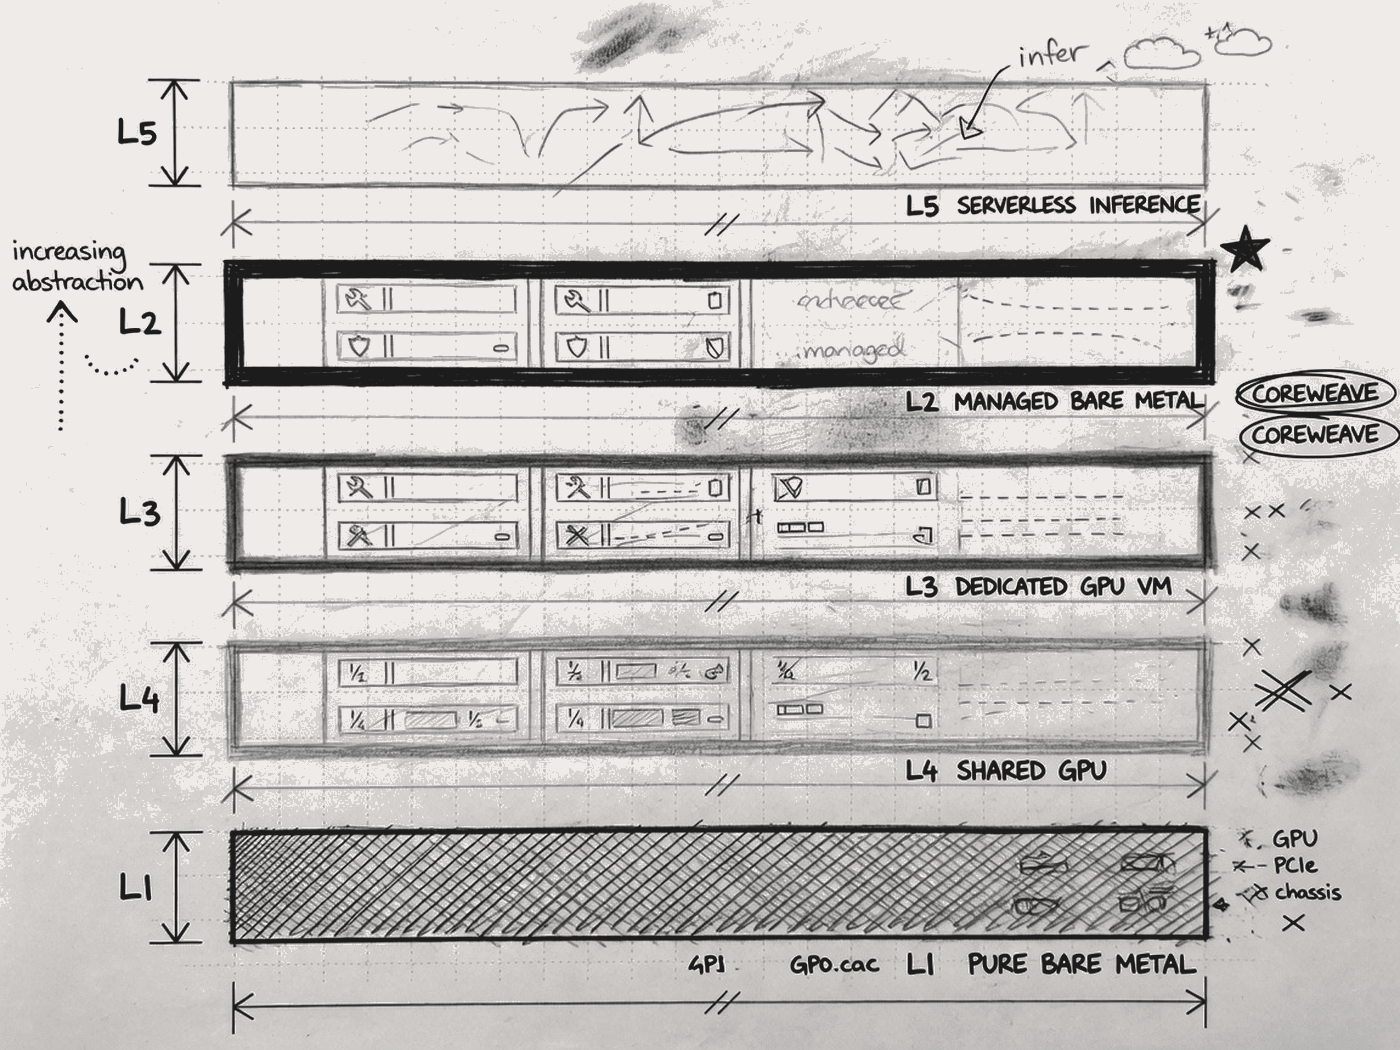
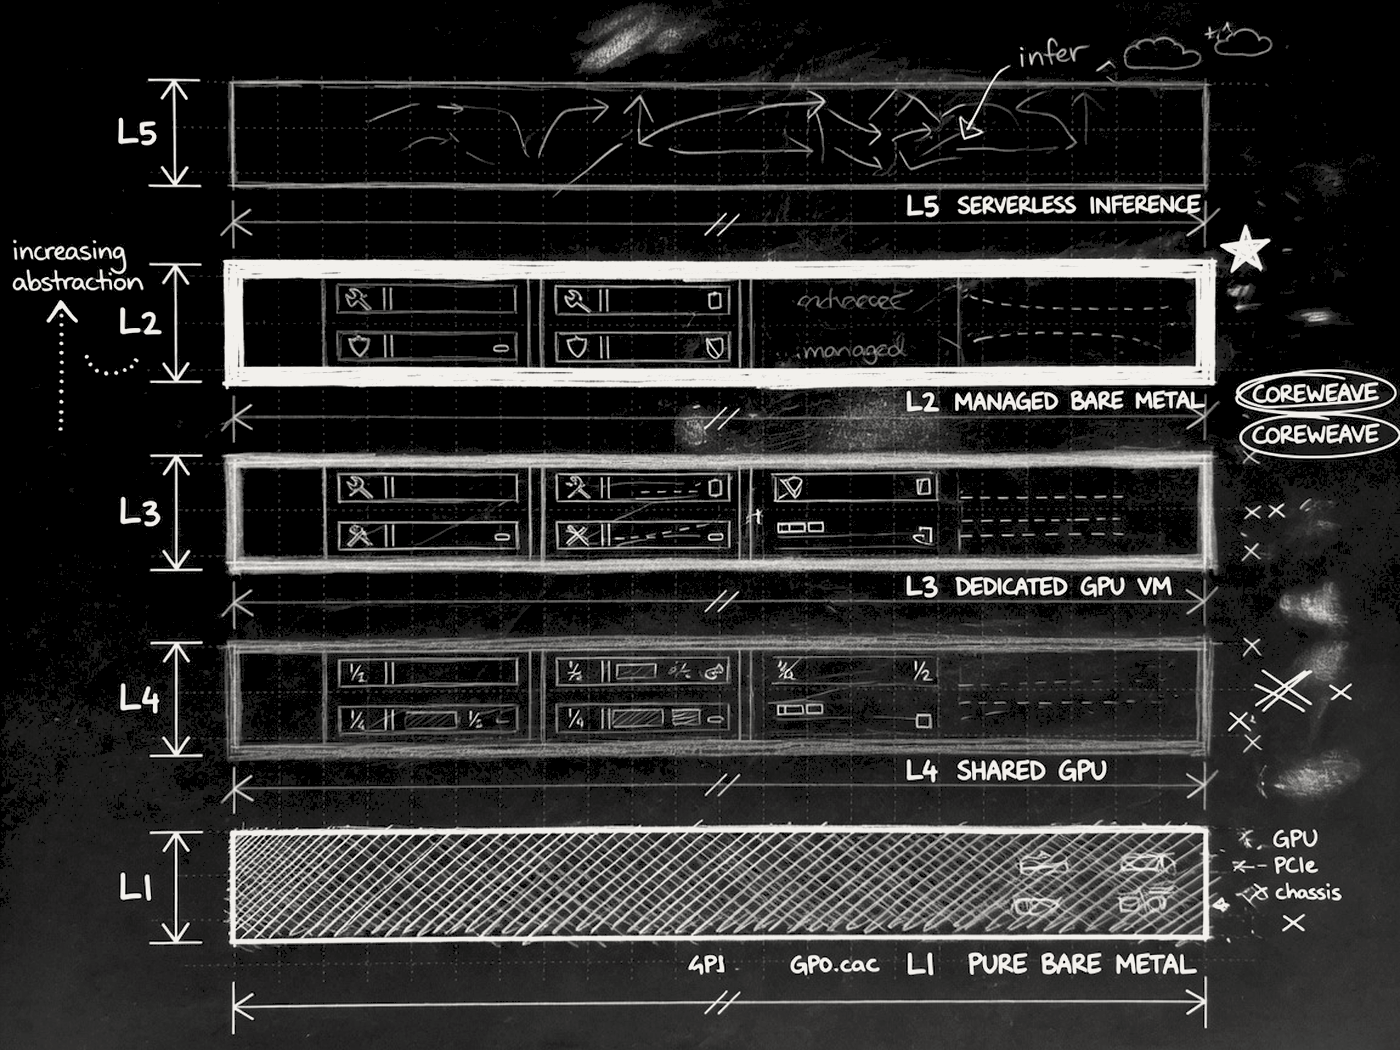
Figure 3.1. Five-layer GPU delivery spectrum from pure bare metal (ASC 842 / BRUN) through managed bare metal (CoreWeave CKS) to serverless inference.
CoreWeave’s core business sits at layer 2—not pure bare metal at the bottom (that is BRUN), and not classic virtualized “cloud” (that is AWS/Azure). It is a managed platform that stacks Kubernetes orchestration, networking, and storage management on bare-metal hardware. Customers need not manage OS and drivers, yet still receive physical GPUs without virtualization overhead.
That positioning determines two things:
First, accounting classification. CoreWeave books all revenue as ASC 606 service contracts (not ASC 842 leases). The 10-K rationale:
*"generally either there are no identified assets or customers do not control or direct the use of underlying hardware. We maintain discretion over server selection and deployment."*
Because CoreWeave manages hardware allocation through the CKS platform and retains discretion over server selection and deployment, it asserts customers “do not control specific hardware”—classifying contracts as services rather than leases. Deloitte marked this judgment a Critical Audit Matter—the boundary is genuinely gray.
Contrast with BRUN: BRUN sells layer-1 pure bare metal—customers obtain “exclusive right to control the use of the GPU servers, including the ability to determine workloads, GPU utilization, and end-user access.” BRUN acknowledges customer control of specific hardware and recognizes revenue under ASC 842 operating leases. Both call it “bare-metal GPU rental,” yet CoreWeave and BRUN reach opposite accounting judgments because product layer differs.
Second, margin structure. Layer 2 can charge a platform-management premium on top of hardware cost; layer-1 pure bare metal is commodity competition with thinner margins. CoreWeave’s K8s orchestration, InfiniBand networking, and S3 storage are packaged inside GPU capacity contracts—customers pay for a “full managed platform,” not bare GPU-hours alone.
3.2 Full Product Matrix and Revenue Contribution
| Product layer | Specific products | Essence | Revenue contribution |
|---|---|---|---|
| Core compute | GPU instances (H100/H200/B200/GB300), multi-year take-or-pay committed capacity | Time/capacity rental of physical GPUs on bare metal | ~98% (committed contracts) |
| Orchestration platform | CKS (Kubernetes Service), SUNK (Slurm on K8s) | Management layer on bare metal—attached to compute contracts, not billed separately | Included in the 98% above |
| Storage | S3-compatible object storage, VAST clusters, distributed file, LOTA acceleration | Data layer—attached to compute contracts | Included in the 98% above |
| Networking | VPC, HPC Interconnect, Direct Connect, Ingress | Connectivity layer—attached to compute contracts | Included in the 98% above |
| Inference services | Serverless Inference, Dedicated Inference, Managed Inference (W&B) | Token/request billing—the only independently billed product line | ARR >$100M (<1% of rev) |
| MLOps | Weights & Biases (experiment tracking, model management) | Cross-cloud SaaS—theoretically independently billable | "not material" (10-Q) |
| Sandbox | CoreWeave Sandbox | Ephemeral compute for agents/code execution | New product; revenue undisclosed |
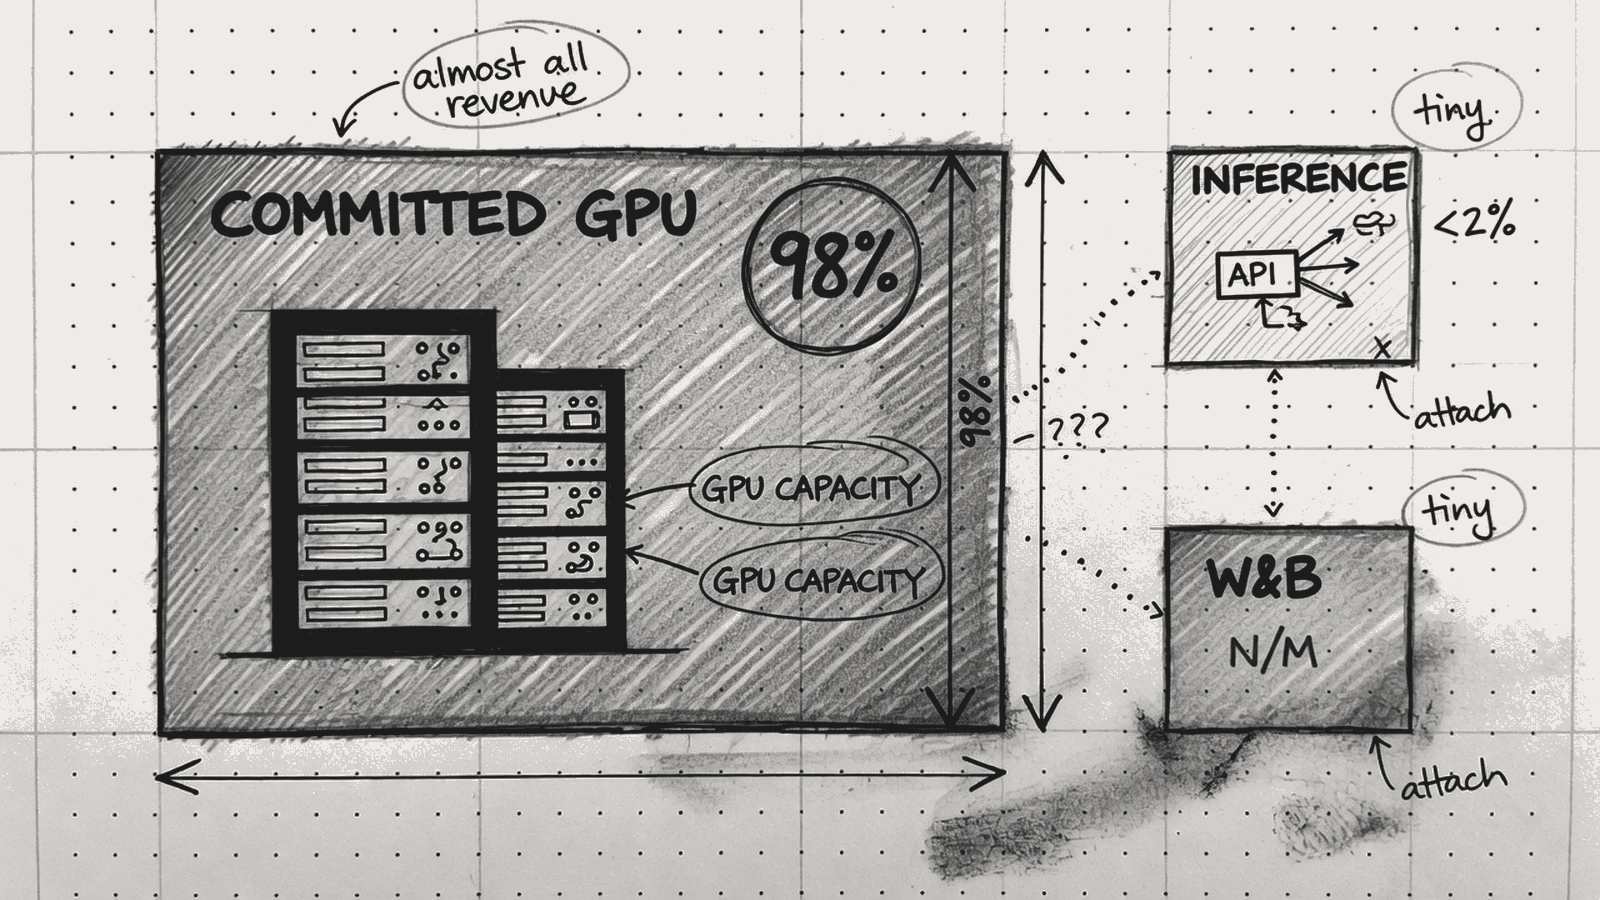
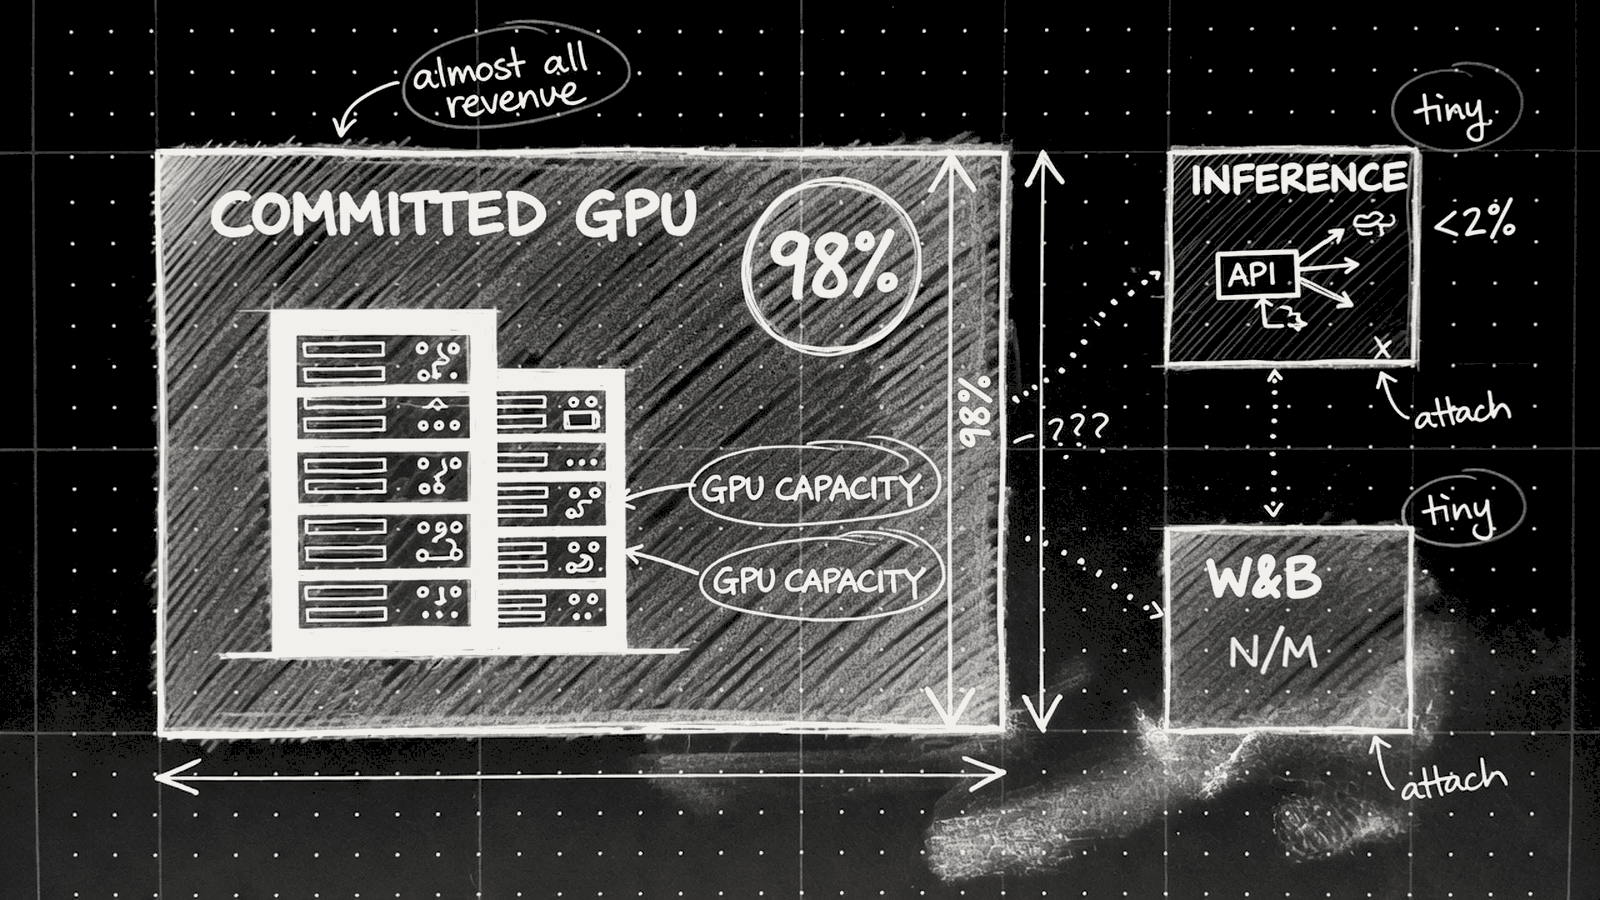
Figure 3.2. Product matrix economics: ~98% of revenue is committed GPU capacity; CKS/storage/network attach inside the capacity contract; Managed Inference and W&B remain <2%.
Key insight: the product matrix looks rich, but aside from Managed Inference (<1%) and W&B (not material), every other product attaches inside GPU capacity contracts and is not billed independently. The 10-K confirms a single reportable segment (AI-native cloud) with no product-line revenue split. CKS, storage, and network contribution cannot be quantified—they are “included extras” on GPU compute contracts, not independent revenue drivers.
3.3 Financial Data Analysis: The Reported Gross-Margin Illusion
CoreWeave’s financial statements contain one central trap: reported gross margin of 66% is an illusion.
| Line | FY2023 | FY2024 | FY2025 | Q1'26 | Q2'26 | % Rev (Q2) |
|---|---|---|---|---|---|---|
| Revenue | $229M | $1,915M | $5,131M | $2,078M | $2,575M | 100% |
| − Cost of Revenue | $69M | $493M | $1,453M | $716M | $879M | 34% |
| = Gross Profit | $160M | $1,422M | $3,678M | $1,362M | $1,696M | 66% |
| − D&A (mostly T&I) | — | $863M | $2,454M | $1,147M | $1,393M | 54% |
| − Other OpEx | $174M | $135M | $770M | $359M | $352M | 14% |
| = Operating Income/(Loss) | ($14M) | $324M | ($46M) | ($144M) | ($49M) | −2% |
| − Interest expense | $28M | $361M | $1,229M | $536M | $640M | 25% |
| = Net Loss | ($594M) | ($863M) | ($1,167M) | ($740M) | ($626M) | — |
| Adj. EBITDA | — | — | $3,093M | $1,157M | $1,510M | 59% |
| Adj. Operating Income | — | — | — | $21M | $128M | 5% |
Table 3.3. Reported P&L stack. 66% gross margin excludes GPU depreciation parked in T&I; economic gross margin after D&A is ~12%.
A 66% gross margin looks SaaS-like, but CoR contains only direct data-center costs (rent, power, on-site staff)—GPU depreciation of $1,393M sits in T&I (Technology & Infrastructure), not CoR. Adding GPU depreciation back, economic gross margin is only ~12%. Cross-company margin comparison therefore fails completely.
CoR composition and incremental split: of FY25 CoR $1,453M, YoY increment +$960M was mainly rent +$566M (largest), power +$203M, power-related D&A +$84M, and other (people, etc.).
SBC by line (FY25 $630M): CoR $15M, T&I $221M, S&M $31M, G&A $363M. SBC concentrates in G&A + T&I, not on the facility floor.
Headcount: YE25 2,189 people (YE24 881, +148%). Revenue/employee ~$2.3M—extreme labor leverage in GPU cloud.
Q2’s critical inflection: Adj. Operating Income jumped from Q1’s $21M (~1%) to $128M (5%) because revenue growth (+24% QoQ) outran D&A growth (+21%). If that trajectory continues, FY26 Adj. Op. Income guidance of $960M–$1.15B is reachable—H2 needs ~$400–510M per quarter. Q3 guidance $200–260M supports the path, implying acceleration continues.
Adj. EBITDA $1,510M (59% margin) looks solid, but EBITDA adds back depreciation equal to 54% of revenue—for an ultra-heavy GPU-cloud model, EBITDA’s reference value is limited. It is like valuing an airline without looking at aircraft depreciation—ignoring the largest real cost.
Capex remains elevated: Q2 cash PP&E purchases $9.35B (3.6× revenue), FY26 guidance raised to $33–37B. Deeply negative FCF is the model’s steady state, not a temporary phase.
Another view of cash conversion: FY25 OCF $3,058M looks fine, but much of it is deferred revenue ($8.2B balance, 1.6× full-year FY25 revenue)—customer prepayments are not profit; they are future delivery obligations. NeoCloud cash-flow quality must be read through deferred revenue.
3.4 M&A Moves: Climbing from “Rent Cards” toward “Platform”
CoreWeave’s M&A logic is clear: stack software layers on top of GPU compute rental, climbing from layer 2 toward layer 5. Every acquisition points the same direction—software margin on top of hardware margin.
| Acquisition | Timing | Consideration | What it does | Strategic meaning |
|---|---|---|---|---|
| Weights & Biases | Completed 2025-05 | $1,029M (accounting; media had cited $1.7B). Goodwill $793M | MLOps platform: experiment tracking, model management, evaluation | Binds AI developer workflows—from “train on CoreWeave” to “manage the full ML lifecycle on CoreWeave.” Cross-cloud runnable = acquisition funnel. But Q1'26 10-Q calls W&B not material to consolidated results—return on $793M goodwill remains unknown |
| Managed Inference platform | Built in-house (not M&A) | — | Serverless + dedicated inference; OpenAI-compatible API; 60+ model catalog | Extends from training into inference—the highest-utilization, fastest-growing GPU workload. ARR from $1M to >$100M; YE26 target $250M |
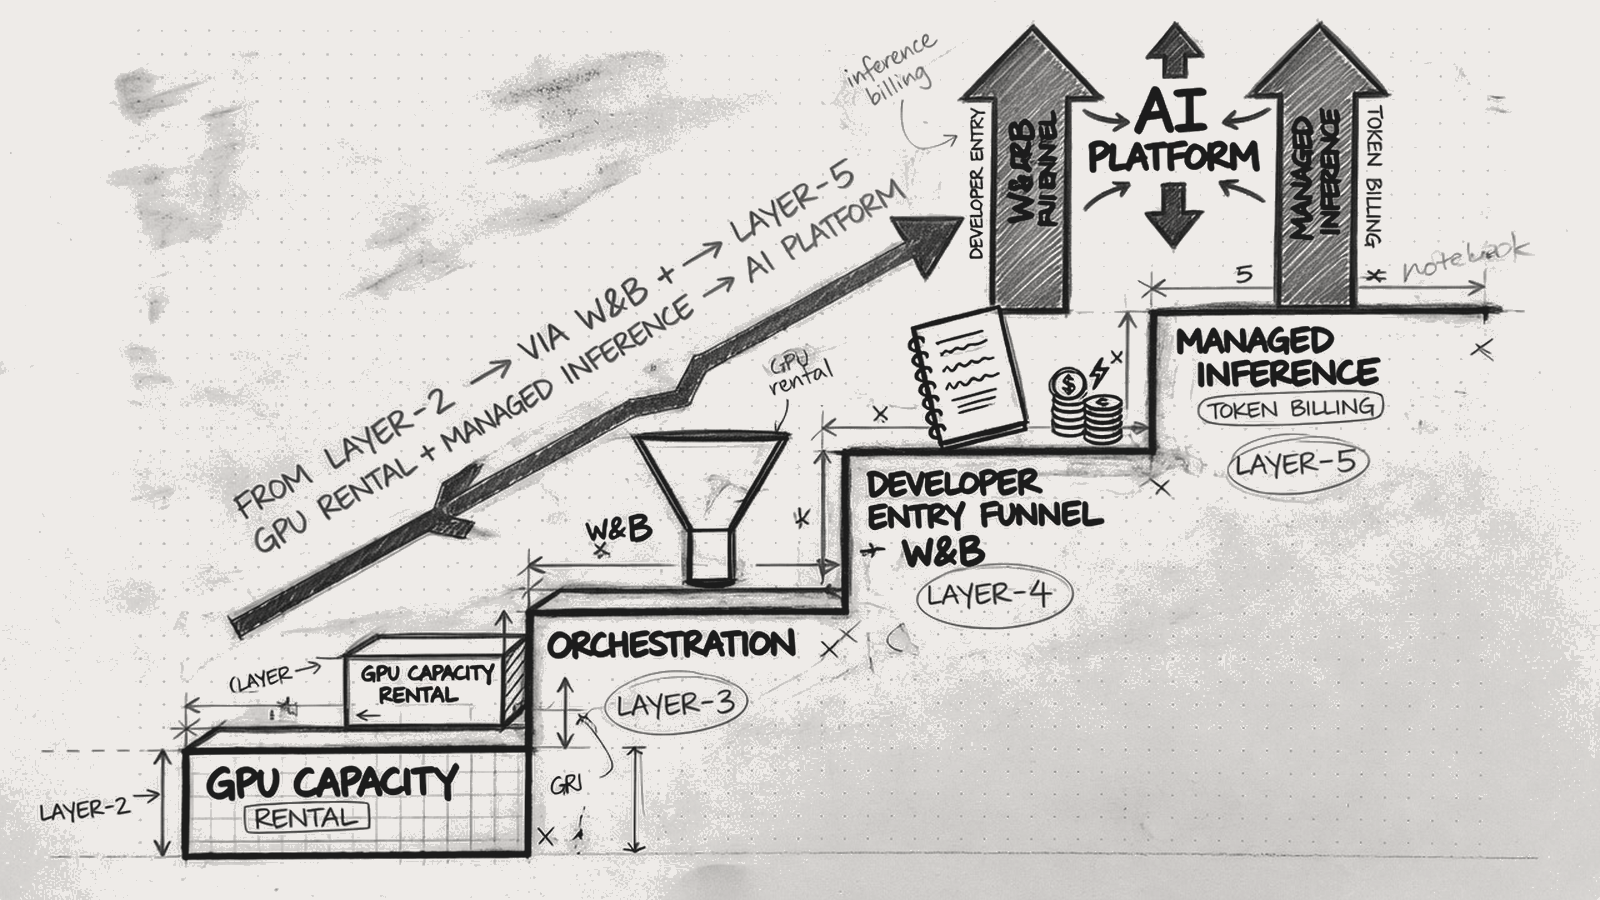
Figure 3.4. Strategic climb: Weights & Biases (developer entry) + Managed Inference (token-priced consumption) aim to move CoreWeave from layer-2 capacity lessor toward layer-5 platform — still <2% of revenue today.
Why this direction is critical:
When NVIDIA’s AI Compute Partnership batch-replicates GPU allocation capability to more NeoClouds, “can you get cards” is no longer a moat. CoreWeave’s long-term differentiation must climb from layer 2 (hardware + orchestration) toward layer 5 (inference/agent platform)—only by stacking software value on GPU-hours can it avoid becoming a pure commodity compute middleman.
W&B and Managed Inference are the two pillars of that transition:
- W&B = developer entry. AI teams manage experiments in W&B → naturally place training workloads on CoreWeave → deploy inference on CoreWeave after training → full-lifecycle lock-in.
- Managed Inference = consumption upgrade. From GPU-hour billing (customer manages everything) to token billing (CoreWeave manages everything)—higher GPU utilization + software premium.
But reality is cold: W&B is “not material,” Managed Inference is <1% of revenue. Today CoreWeave still derives >99% of revenue from layer-2 GPU capacity contracts. Platform transformation is a 3–5 year direction, not today’s reality. $793M of W&B goodwill and a $250M Managed Inference ARR target remain a decimal-point story against $12.8B of annual revenue.
3.5 Future Direction Judgment
Based on the product matrix and M&A moves, CoreWeave’s business evolution path can be summarized as:
| Stage | Product layer | Revenue structure |
|---|---|---|
| 2019–2023 | Layers 1–2 (bare-metal GPU rental) | 100% of revenue |
| 2024–2026 | Layer 2 (managed bare-metal AI cloud) | ~98% committed + <2% inference |
| 2027–2028E | Layers 2+5 hybrid (compute + inference platform) | Target: inference ARR share 5–10% |
| 2029+ | Layers 2+5 balanced (if successful) | Hardware + software dual engine |
If the transformation succeeds—Managed Inference ARR grows from $250M to $2–3B while W&B begins contributing measurable revenue—CoreWeave’s valuation framework migrates from “infrastructure multiples” (EV/EBITDA 14×) toward “platform multiples” (EV/Revenue 10×+). That is a core bull-case catalyst.
If the transformation fails—CoreWeave stays at layer 2 as a GPU lessor with platform packaging. After NVIDIA AI Compute Partnership gives more competitors equal GPU supply terms, pure compute rental pricing power will keep compressing. That is a core bear-case risk.