F.F

F.F Research · AI · 12 August 2026

CoreWeave: A Contract-Covered Leveraged Compute Factory

$104B backlog versus ~$87B of broad obligations — a four-dimension teardown of the public-market NeoCloud benchmark.

Thesis

Not a cloud company — a leveraged compute factory

Debt leverage drives capacity Customer contracts cover revenue GPU generation cycles set the clock
  • Backlog: $104.2B (Q2'26), ~98% committed.
  • Obligations: ~$87B on- + off-balance, 84% of backlog.
  • Margin trap: reported gross margin 66%, economic ~12%.
  • Inflection: Q2 Adj. Op.Inc $21M→$128M; positive FCF still ahead.
  • Pivot: W&B + Managed Inference still <2% of revenue.

Snapshot · Q2'26 / FY26 guidance

Four decisive magnitudes

~$12.8BFY26 rev guidance mid
$104BRevenue backlog
$35BInterest-bearing debt
1.5 GWActive power

Research cutoff 2026-08-12. Backlog and debt from company public disclosures; active power as of Q2 end.

Article architecture

History → resource flywheel → business & finance

  1. 01

    Company history and transformation

    Miner → VFX GPU cloud → AI NeoCloud; revenue and sites scale exponentially.

  2. 02

    Core resources and capabilities

    Data centers · customer contracts · financing · GPU four-dimension flywheel.

  3. 03

    Business split, finance, and M&A

    Five-layer product spectrum, margin illusion, platform climb.

Chapter 01

Company history and transformation

Core capability is not trend prediction — it is pivoting to the highest-paying buyer as GPU demand tides shift.

  1. 1.0 Timeline key nodes
  2. 1.1 Revenue and capacity expansion
  3. 1.2 Enduring endowments: ops DNA + NVIDIA relationship

Chapter 1 · Timeline

The same cards served three markets

Atlantic Crypto

ETH mining

CoreWeave

VFX / render GPU cloud

AI breakout

$229M · DDTL 1.0

MSFT scale

$1.9B · 32 DC

IPO CRWV

$5.1B · W&B

1.5 GW

$12.8B guidance

Chapter 1 · Scale

$229M → ~$12.8B — four years of contract-levered output

FY23$229M
FY24$1.9B · +736%
FY25$5.1B · +168%
FY26E~$12.8B

~85% of FY25 growth from existing-customer expansion; not AWS-style long-tail organic growth.

Chapter 02

Core resources and capabilities

Three pipelines in parallel; one hard constraint chains them: contract → draw → buy cards.

  1. 2.0 Business-model flywheel
  2. 2.1 Data-center resources
  3. 2.2 Customer contracts / Backlog
  4. 2.3 Financing and capital structure
  5. 2.4 GPU and NVIDIA

Chapter 2 · 2.0 Flywheel

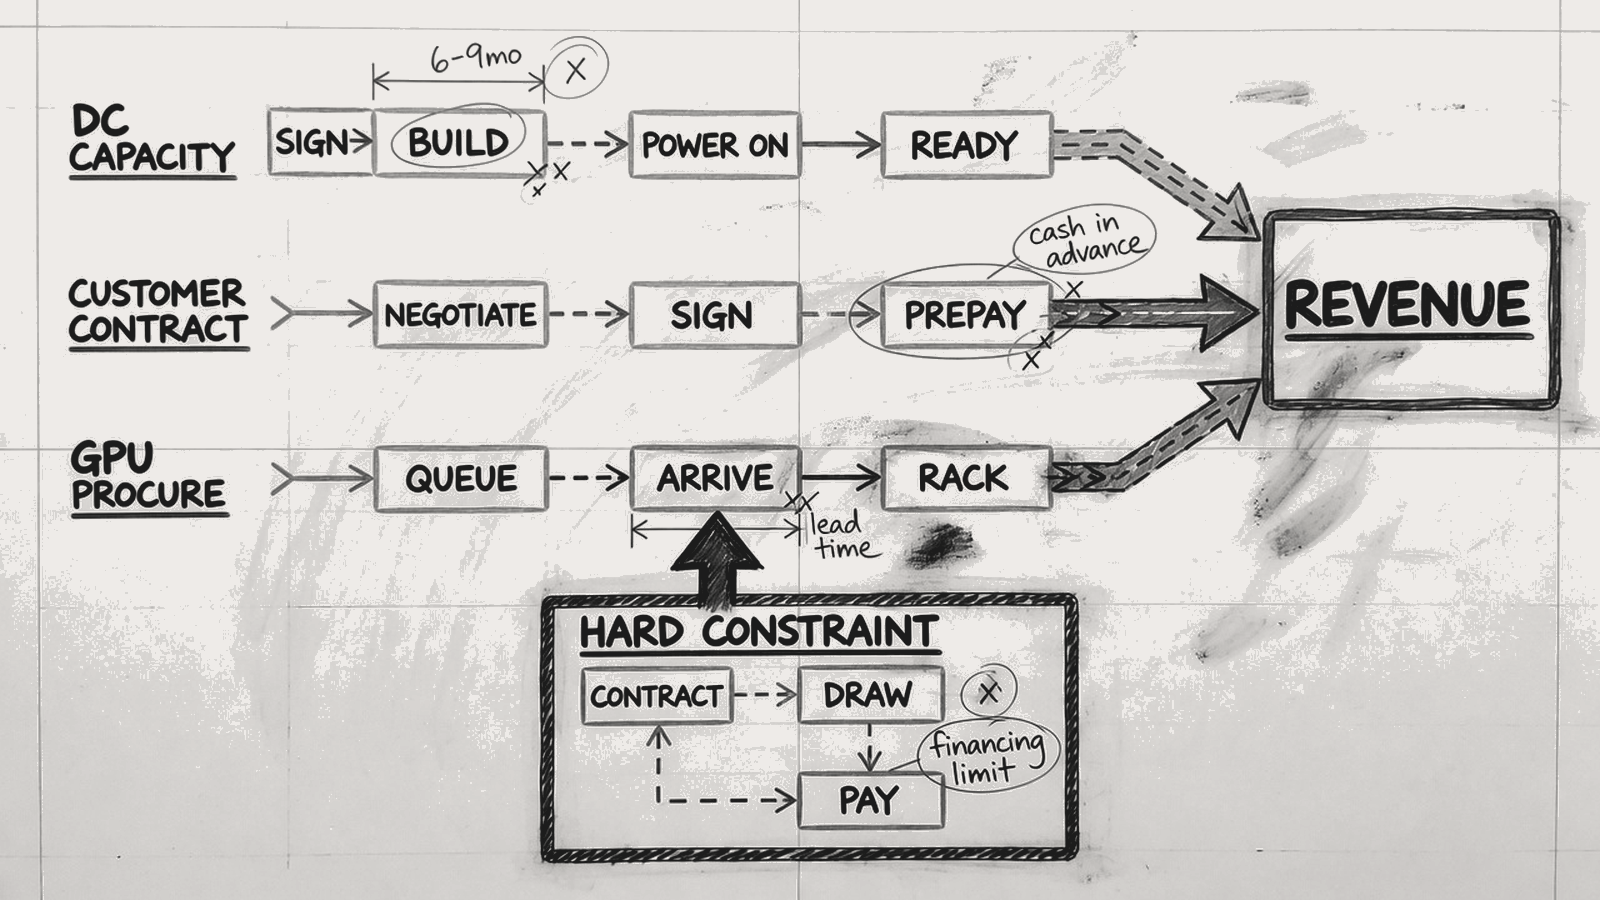
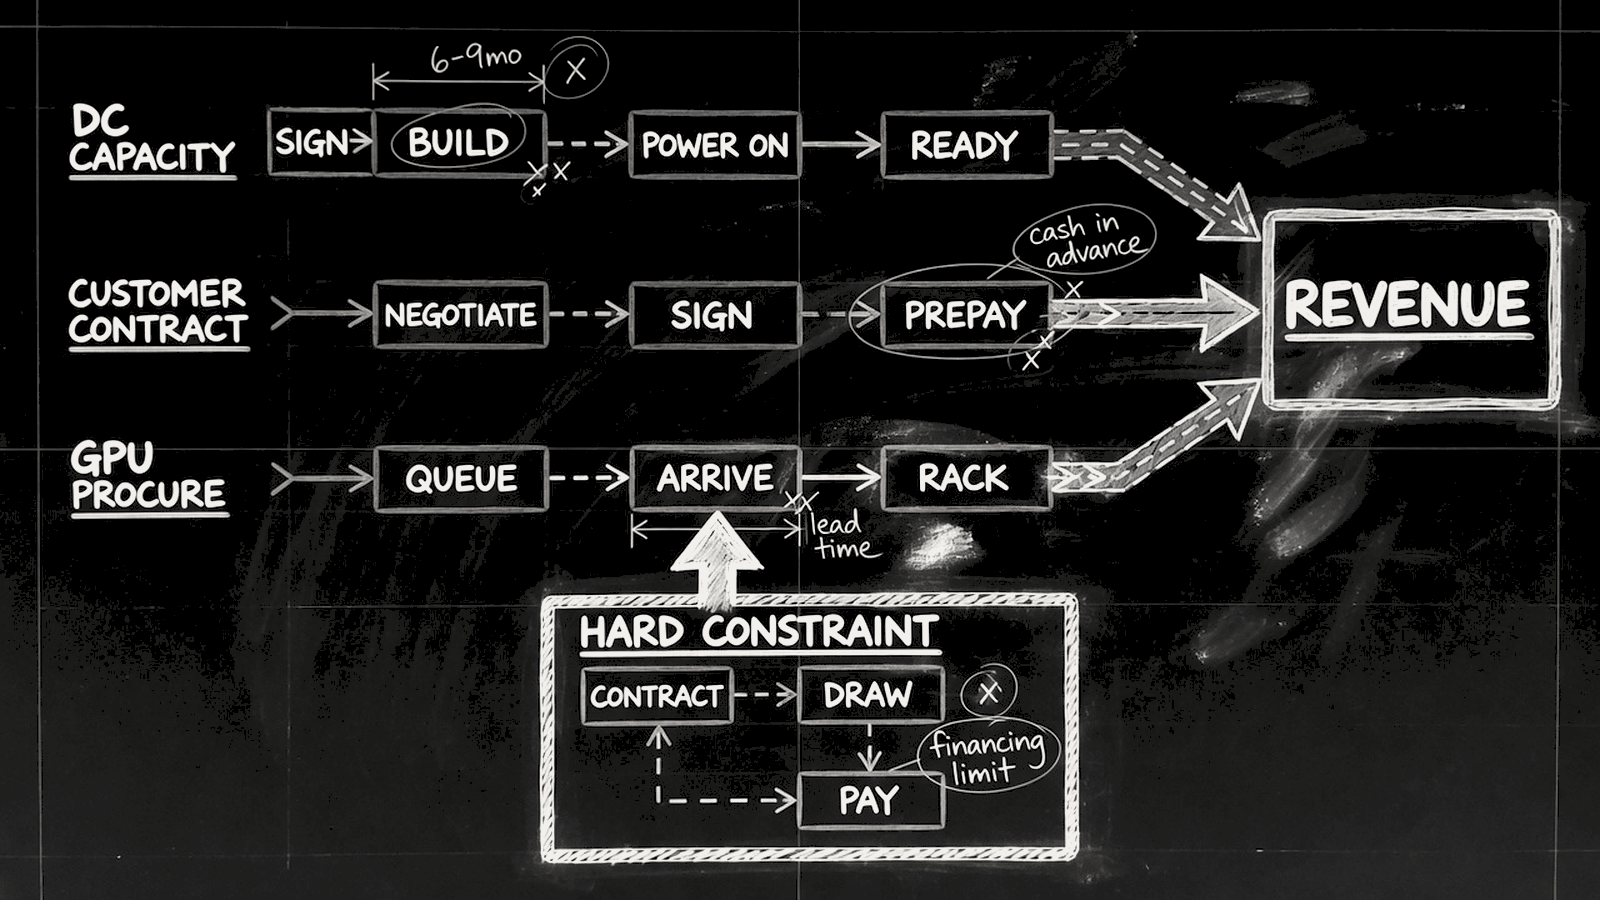
Cost is a clock; revenue is an event

  • DC capacity signed moderately ahead — $47.3B off-balance leases.
  • Customer contracts may carry delivery conditions — backlog can exceed deliverable capacity.
  • GPU procurement queues for allocation; no contract, no DDTL draw.
  • Hard constraint: S-1 confirms “GPUs procured only after customer contract.”
Three pipelines converging to revenue under hard financing constraint

Chapter 2 · 2.1 Data centers

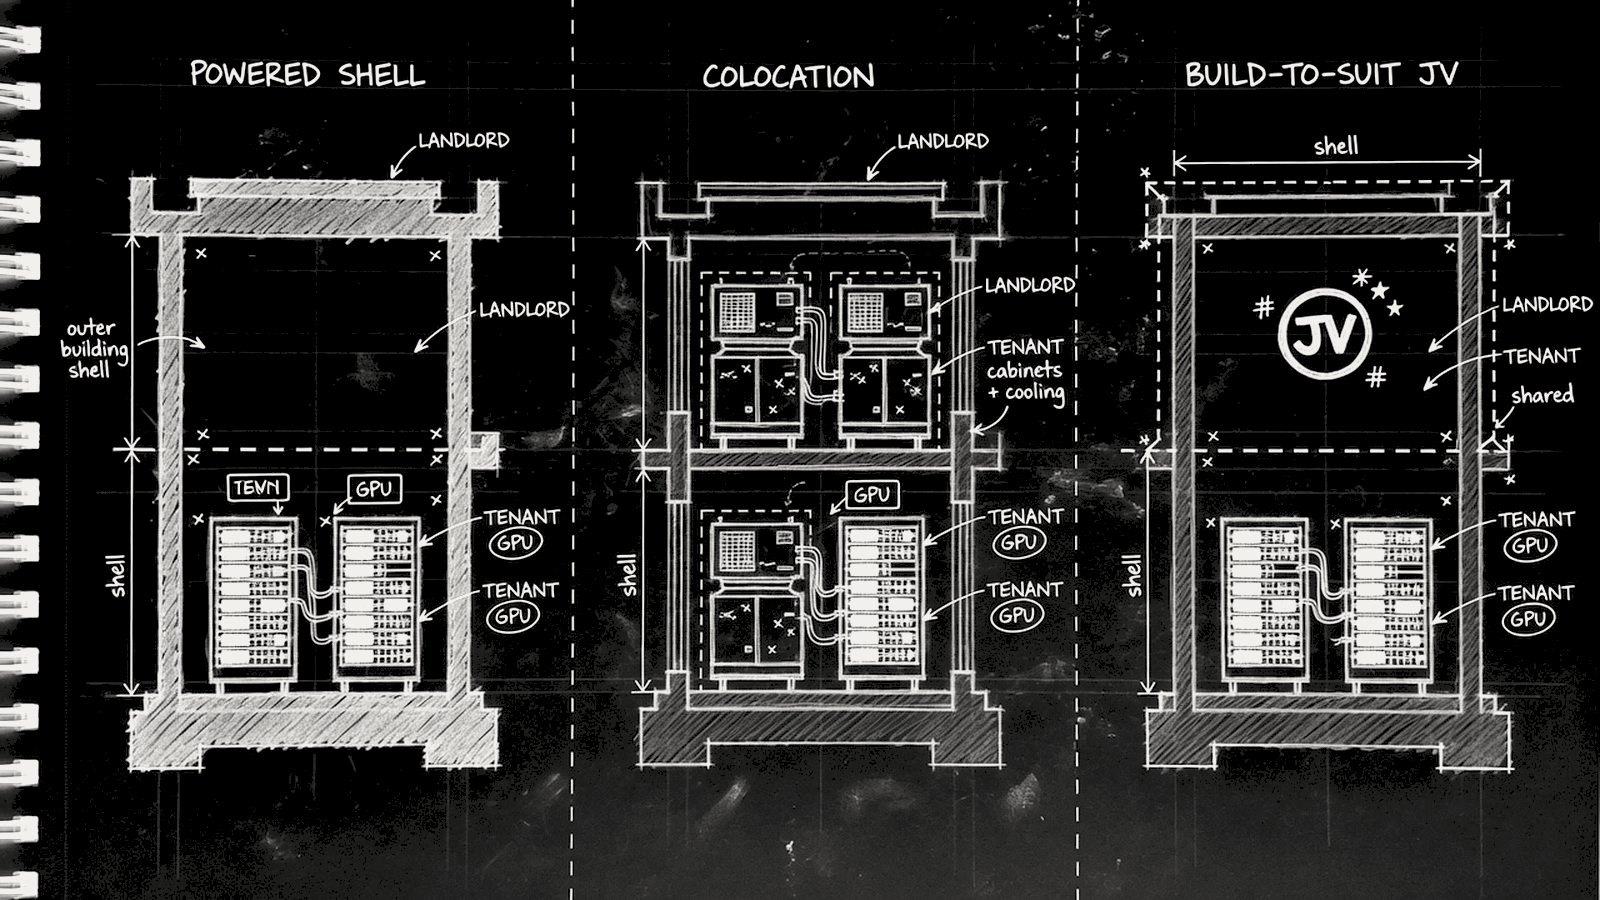
Zero owned real estate: GPU owner, facility tenant

Powered Shell

Landlord provides shell + power; CW provides GPU/network/custom cooling.

Colocation

Landlord provides racks/power/cooling/security; CW provides GPU + network.

Build-to-Suit JV

Kenilworth is the only 15% equity experiment.
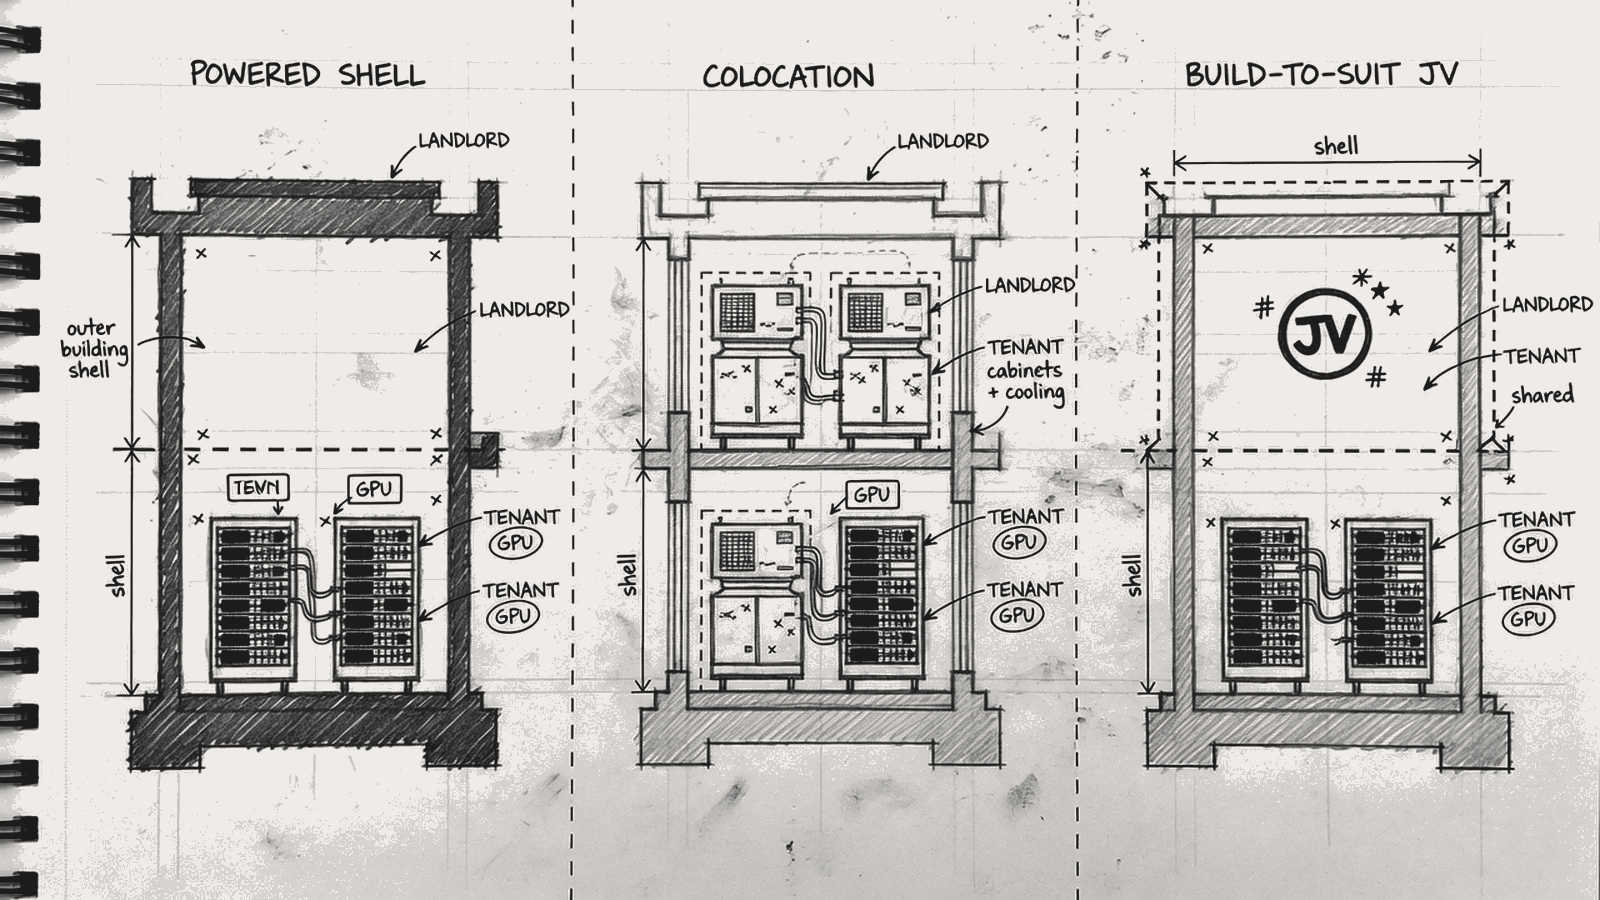
Three partnership modes cross-sections

Chapter 2 · 2.1 Capacity

Active 1.5 GW, contracted 3.7 GW — the bottleneck is go-live speed

YE'23~70 MW
YE'24~360 MW
YE'25~850 MW
Q2'261.5 GW

Active/contracted ~40%. FY27 peak demand ~2.8–3.3 GW; contracted ceiling is enough — grid interconnect and liquid cooling execution are the constraints.

Chapter 2 · 2.1 Off-balance

$47.3B off-balance leases: hidden rigid cost

$38.5BNot-yet-commenced leases
$13.5–14.4BLargest single site (393 MW)
$8.2BOn-book lease liabilities PV
~53%DC cost / $104B backlog

Non-cancelable; enter the balance sheet only on energization. Rent is still due without customers — rigid cost vs elastic revenue.

Chapter 2 · 2.2 Contracts

$104B backlog: not unconditional receivables

YE'25$66.8B
Q1'26$99.4B
Q2'26$104.2B

Take-or-pay

Fixed capacity/fee; 98% committed.

RPO ≈ Backlog

Q2 gap only $0.5B — delivery-condition gap compressed.

$9.4B hard

Deferred $8.2B + deposits $1.2B.

Chapter 2 · 2.2 Concentration

Microsoft remains the single largest variable

FY2335%
FY2462%
FY2567%
Q1'2645% · top2 65%

Legal contract protection exists, but you cannot sue the customer that is the bulk of revenue. True protection is GPU scarcity.

Chapter 2 · 2.3 Financing

From 15% GPU pawnshop to investment-grade SPV

DDTL 1.0

GPU ABL · ~15%

DDTL 2–3

Contract term loans

DDTL 4.0

Meta SPV · A3 · SOFR+2.25%

Notes + Eurobond

Unsecured + public syndicate

$35.1BTotal debt Q2'26
~$7.3%Blended cost est.
25%Interest / Q2 rev
~$87BTotal obligations

Chapter 2 · 2.3 Magnetar

Largest selling-pressure source: one of hedge-fund history’s best single bets

$50M seed

Convert notes

DDTL lead

Debt + MagAI deposit

IPO exit RP

Leave board

Peak 91.4M

72% of fund AUM

Sell-down

>$5.5B sold

Chapter 2 · 2.4 GPU / NVIDIA

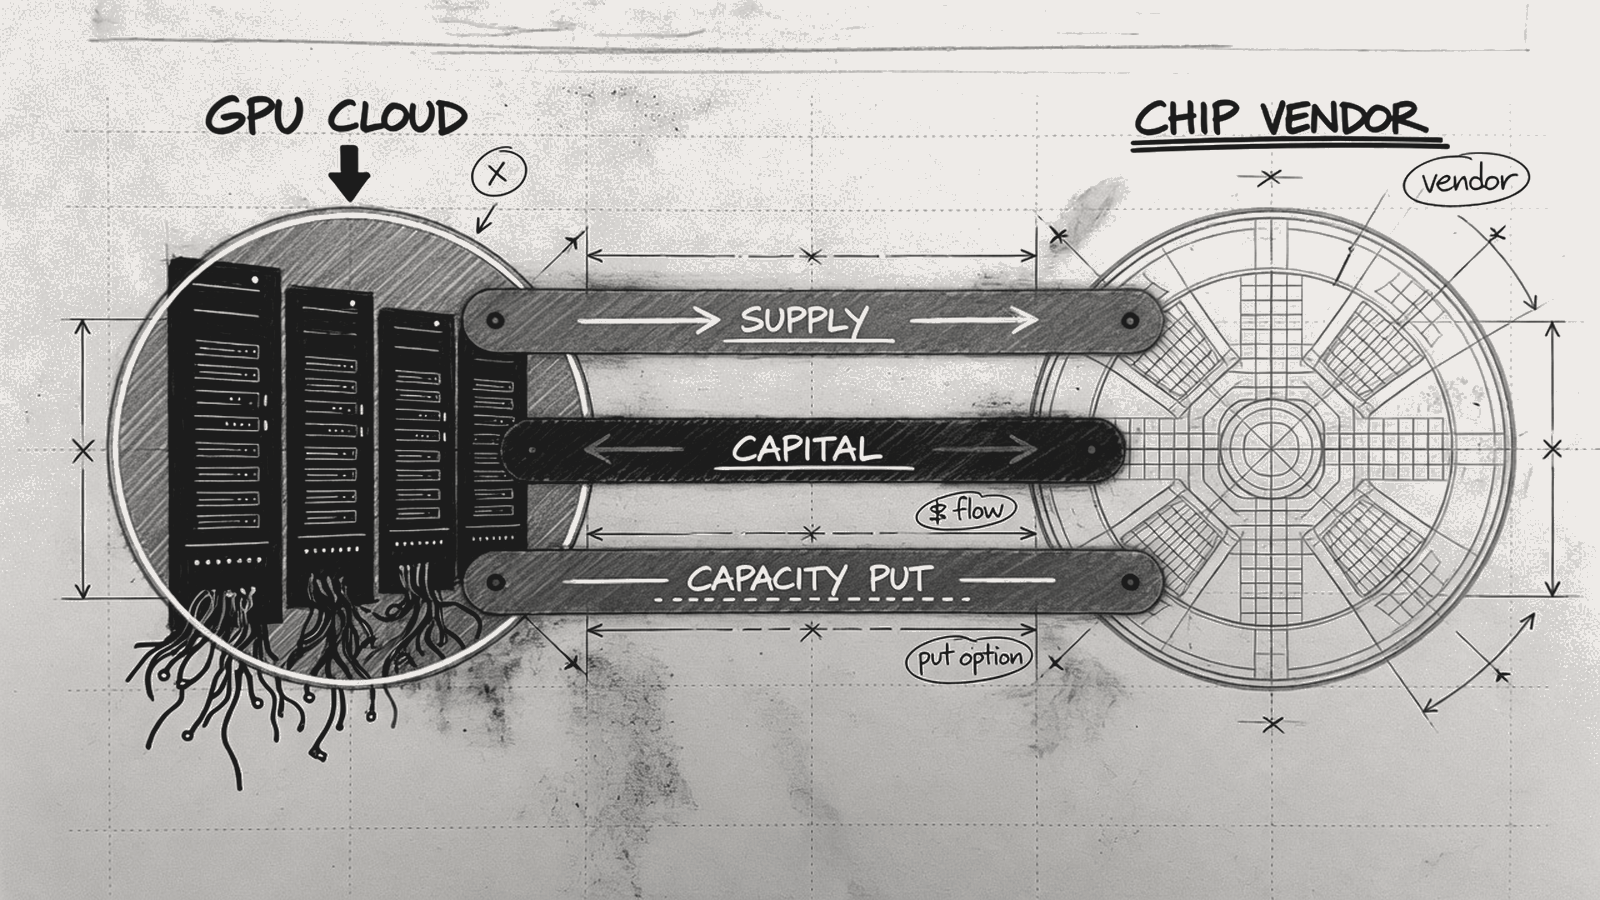
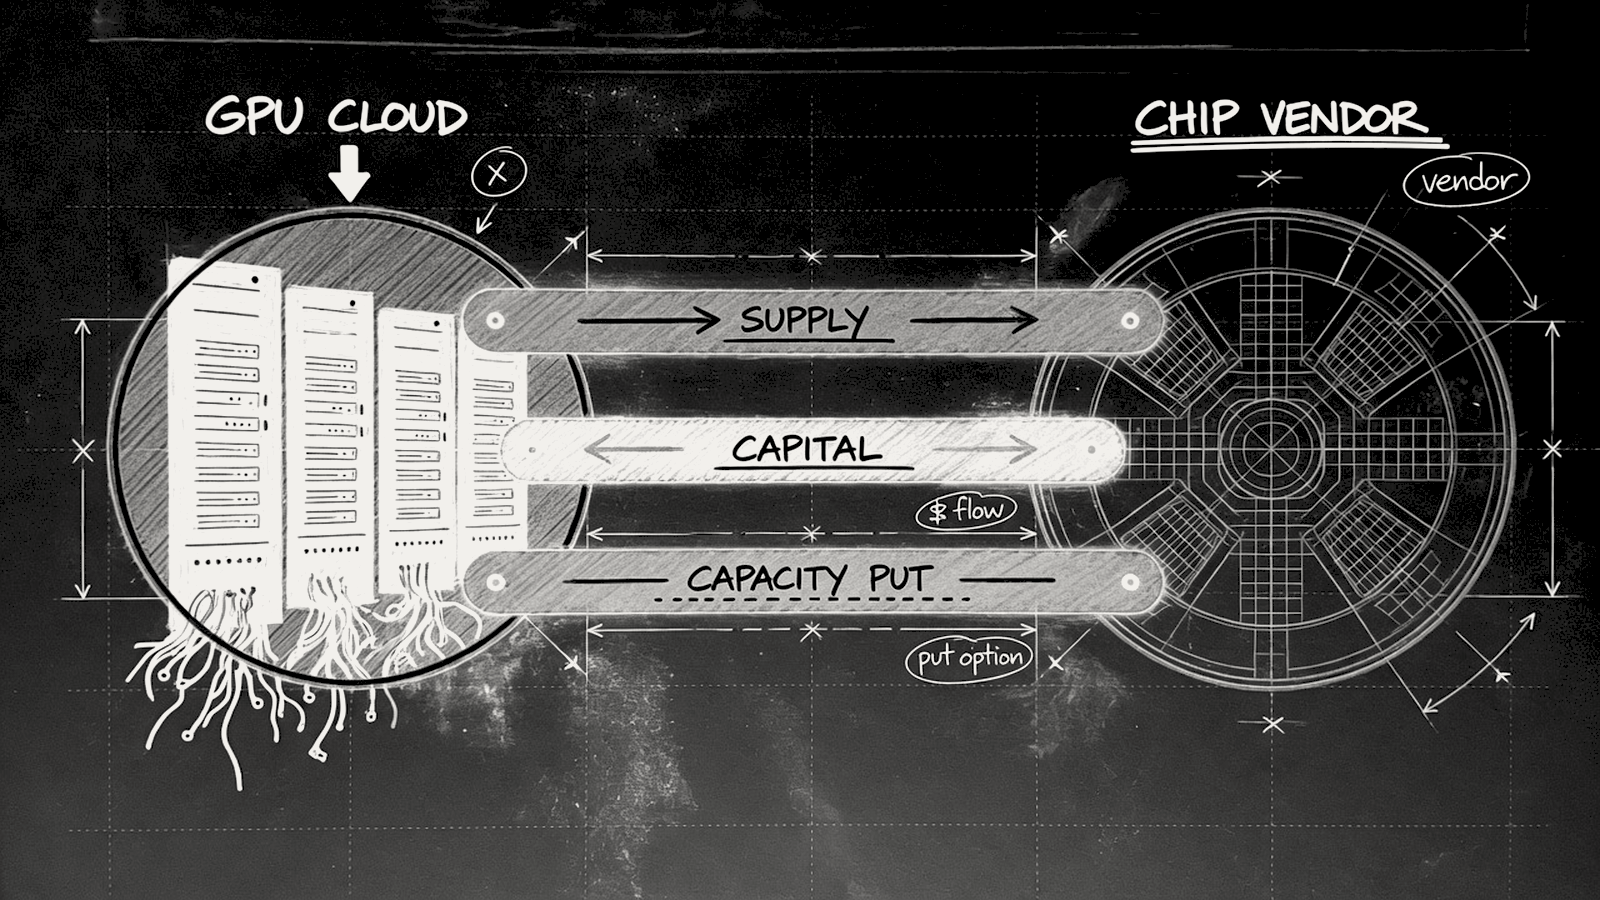
Three-layer binding: supply · capital · capacity put

  • Supply: no long-term price lock — allocation and relationship.
  • Capital: NVIDIA ~10.55% ($2B @ $87.20).
  • Capacity put: $6.3B through 2032 — lender credit enhancement.
  • Black box: model mix, utilization, $/GPU-hr all unavailable.
  • Depreciation: 6-year life assumption; 4-year case costs ~$1.7B/yr more.
Three-layer NVIDIA binding diagram

Chapter 03

Business split, financial analysis, and M&A direction

Core sits at layer 2; gross margin is an illusion; the climb has barely begun.

  1. 3.1 Five-layer product spectrum
  2. 3.2 Revenue composition
  3. 3.3 Reported gross-margin illusion
  4. 3.4–3.5 M&A and future direction

Chapter 3 · 3.1 Spectrum

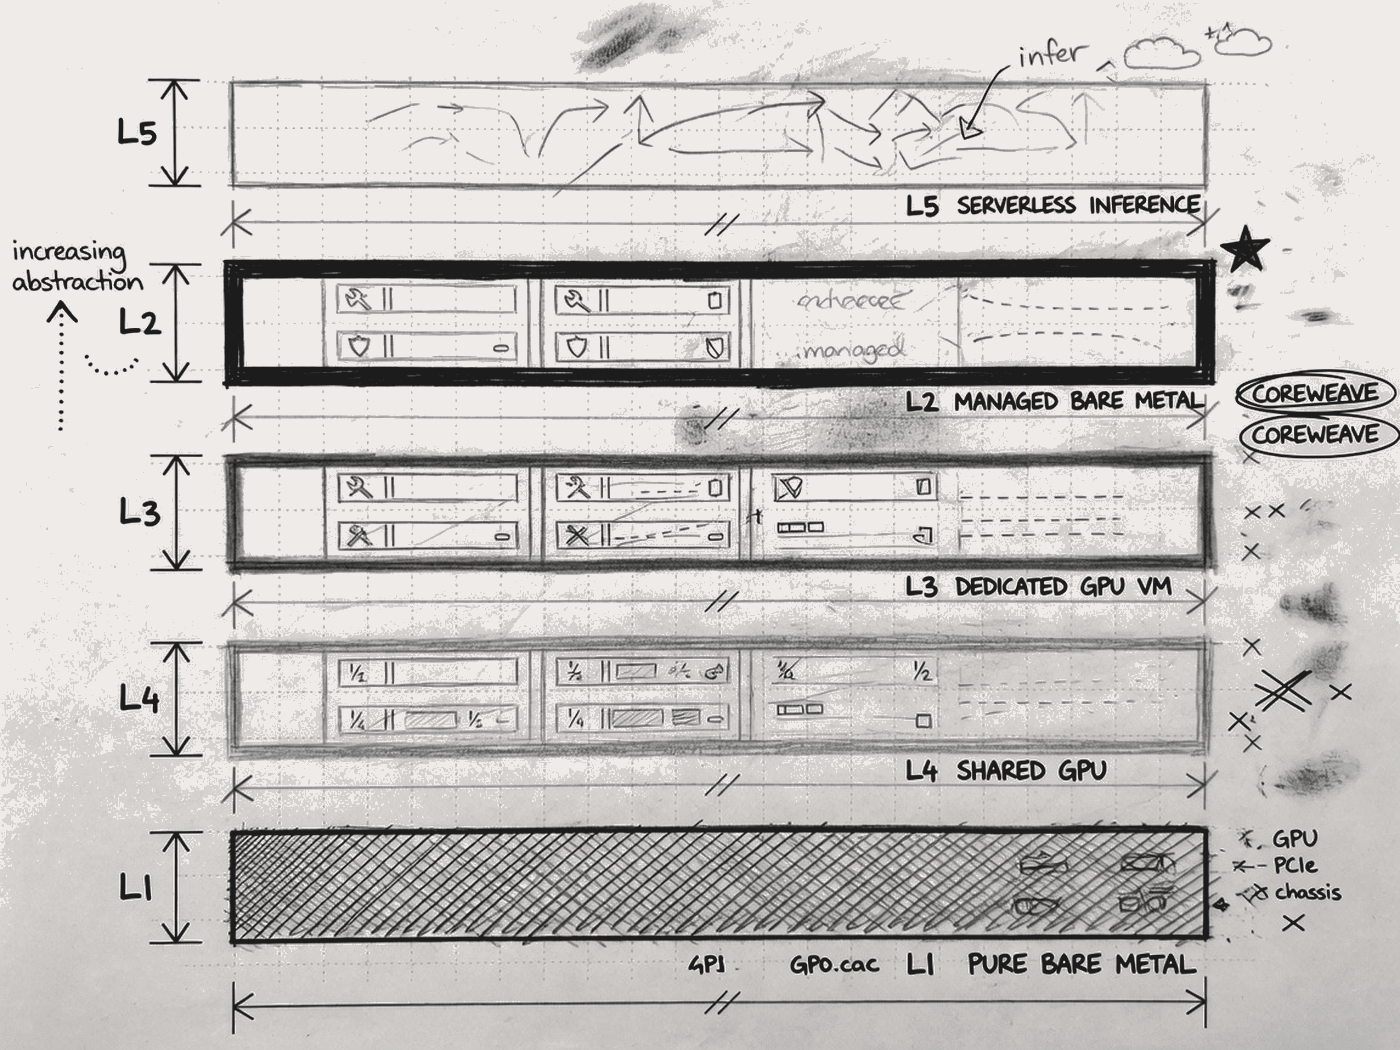
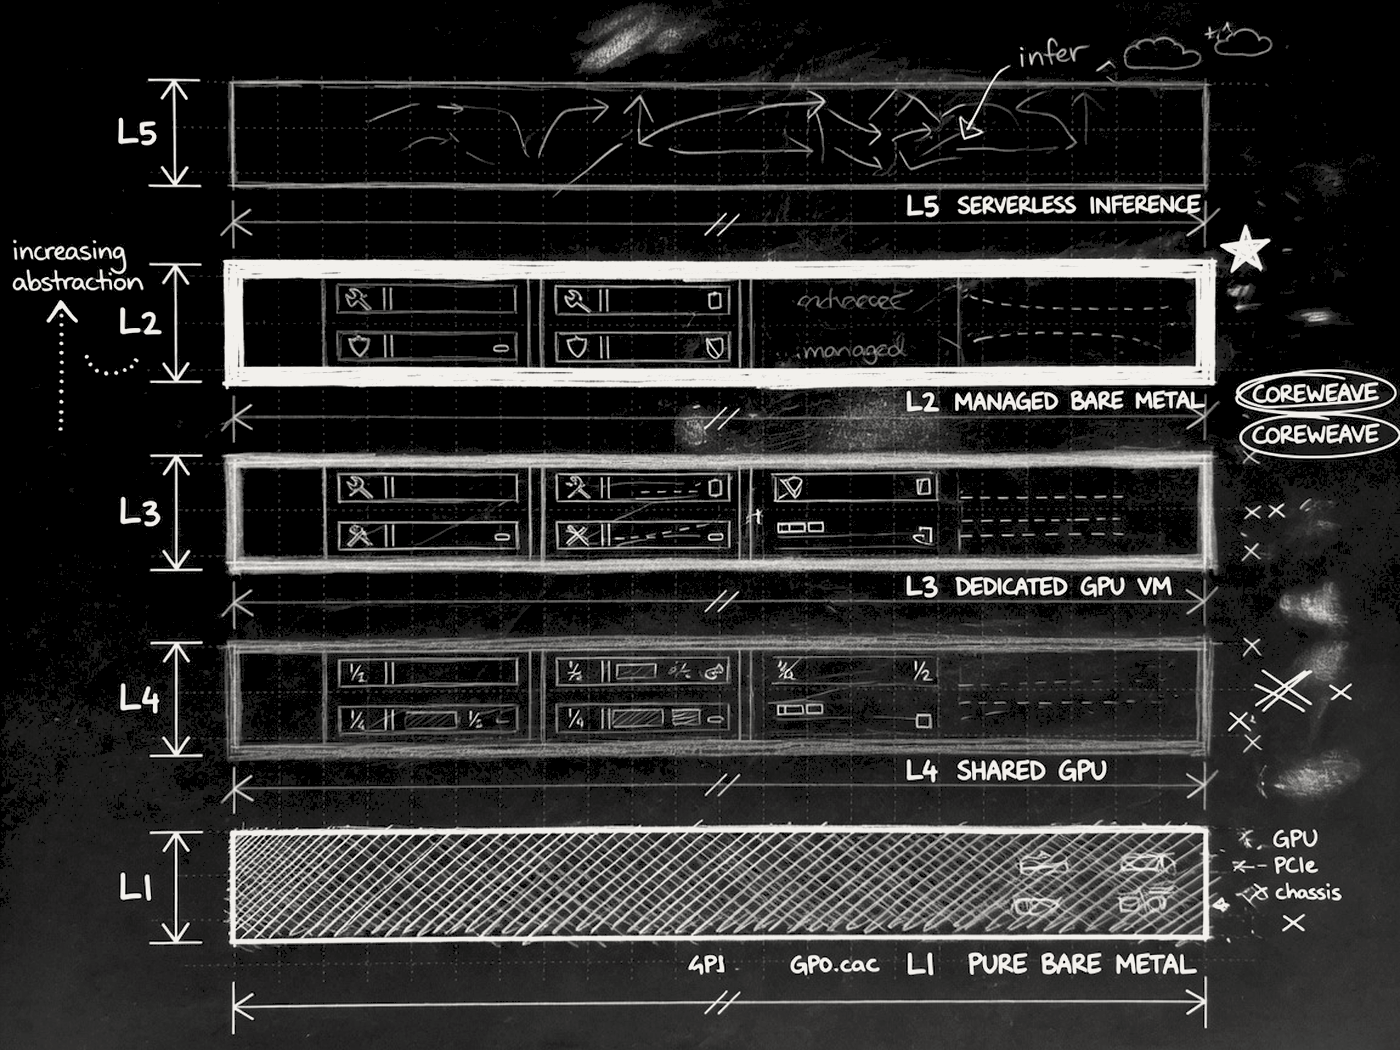
Core at L2: managed bare metal — neither BRUN nor AWS

L5 Serverless inference

API / token; Managed Inference

L3–4 Cloud instances

Dedicated or shared virtualized GPU

L2 Managed bare metal

CoreWeave CKS core · ASC 606

L1 Pure bare metal

BRUN · ASC 842 lease

Five-layer GPU delivery spectrum

Chapter 3 · 3.2 Composition

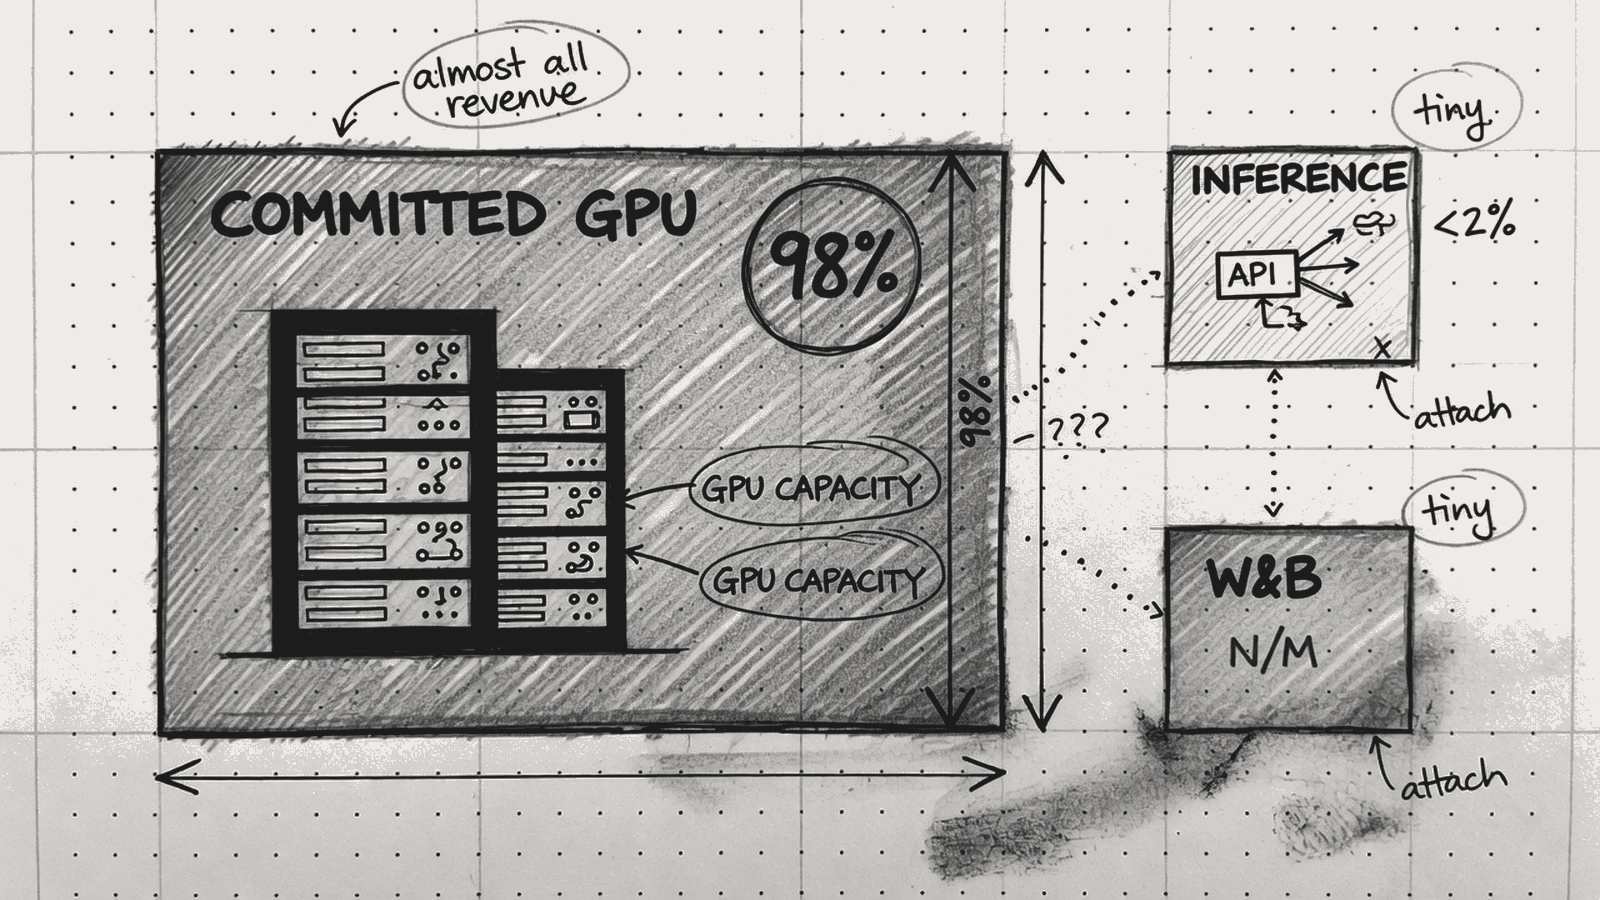
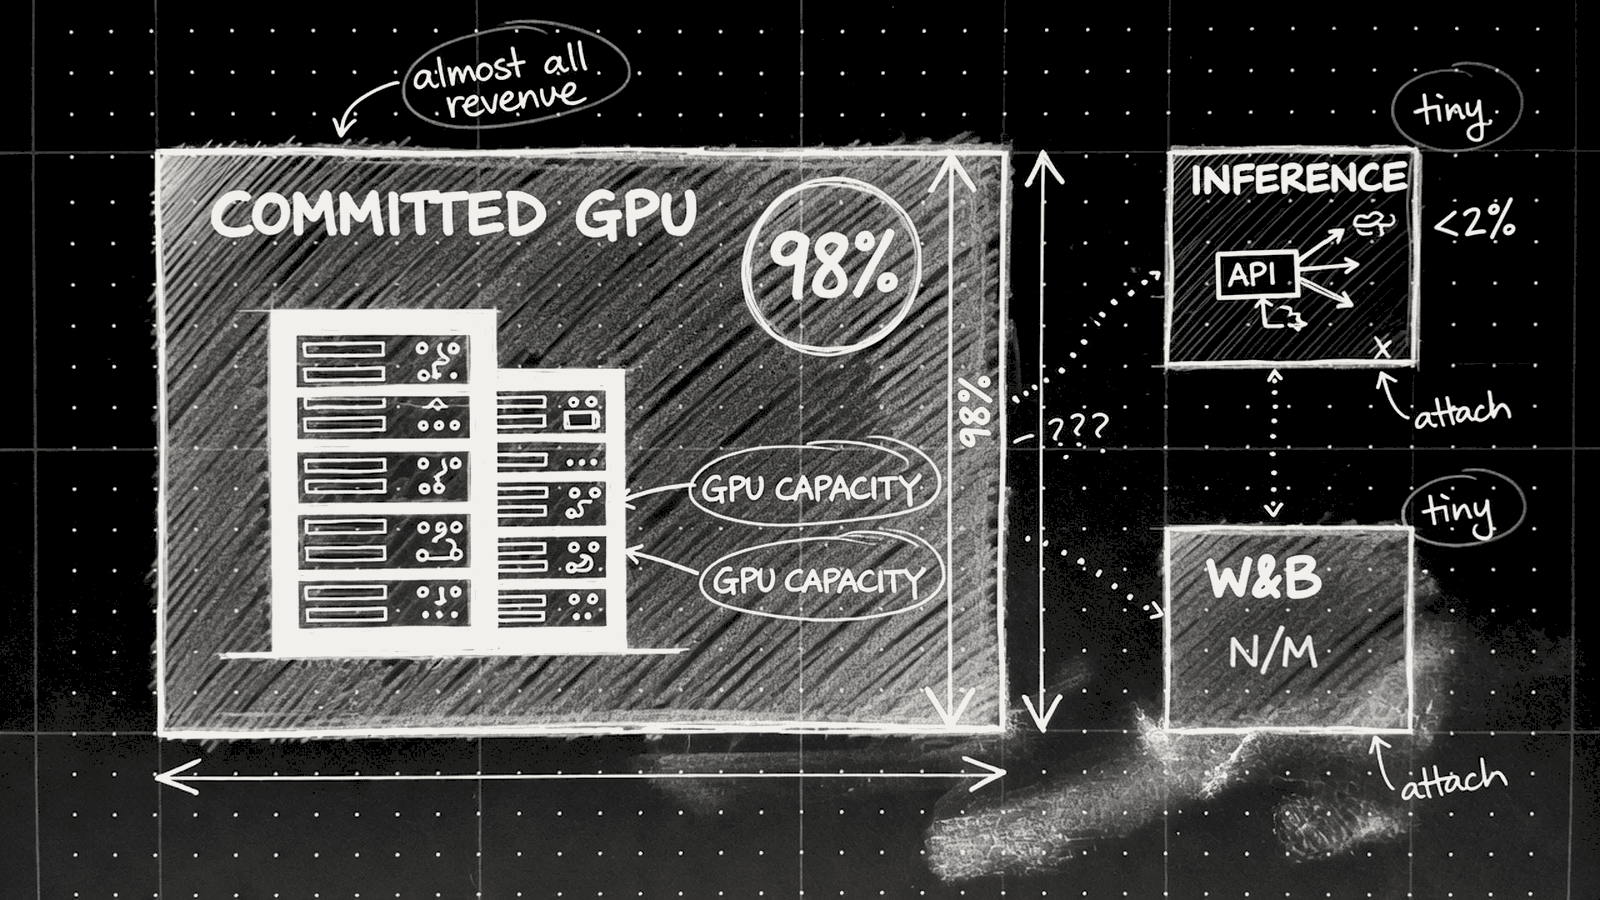
~98% is still committed GPU capacity contracts

  • CKS / storage / network attach inside capacity contracts — not billed separately.
  • Managed Inference ARR >$100M, YE26 target $250M, still <2%.
  • W&B not material to consolidated results.
  • Single reportable segment — product-line split unavailable.
Revenue composition 98 percent committed GPU

Chapter 3 · 3.3 P&L

66% gross margin is an illusion; economic margin ~12%

Revenue$2,575M
CoR34% · rent/power/site
D&A54% · mostly in T&I
Interest25% · $640M
Adj. Op.Inc5% · $128M inflection

Of every $4 earned: $1 interest, $2 depreciation, $1 covers the rest. Adj. EBITDA 59% has limited value for heavy-asset GPU cloud.

Chapter 3 · 3.4–3.5 Direction

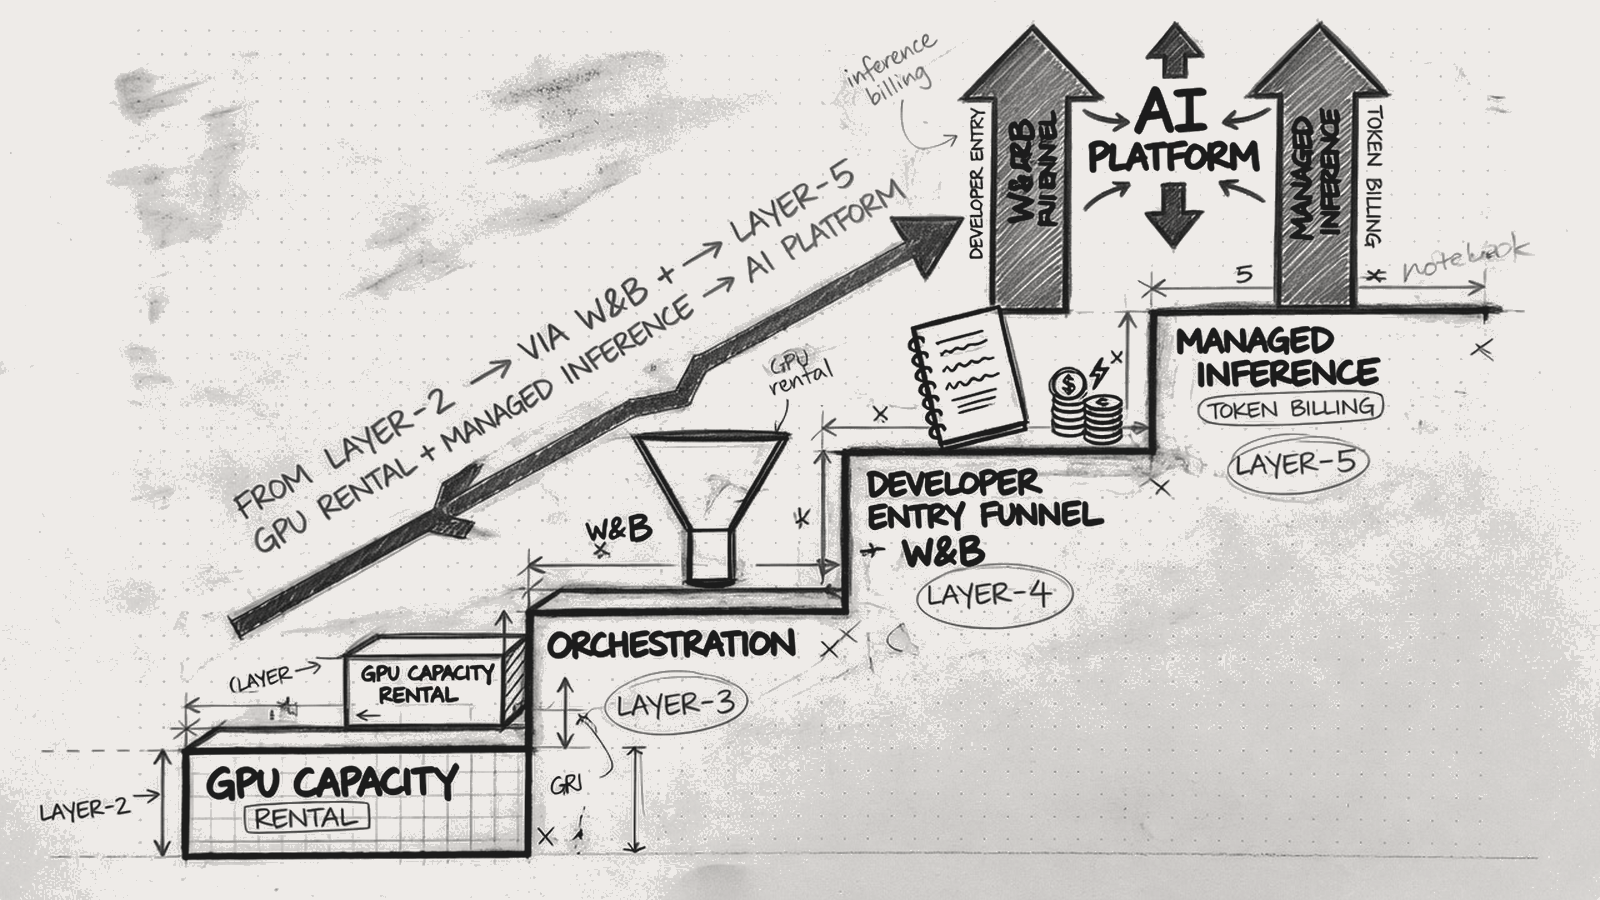
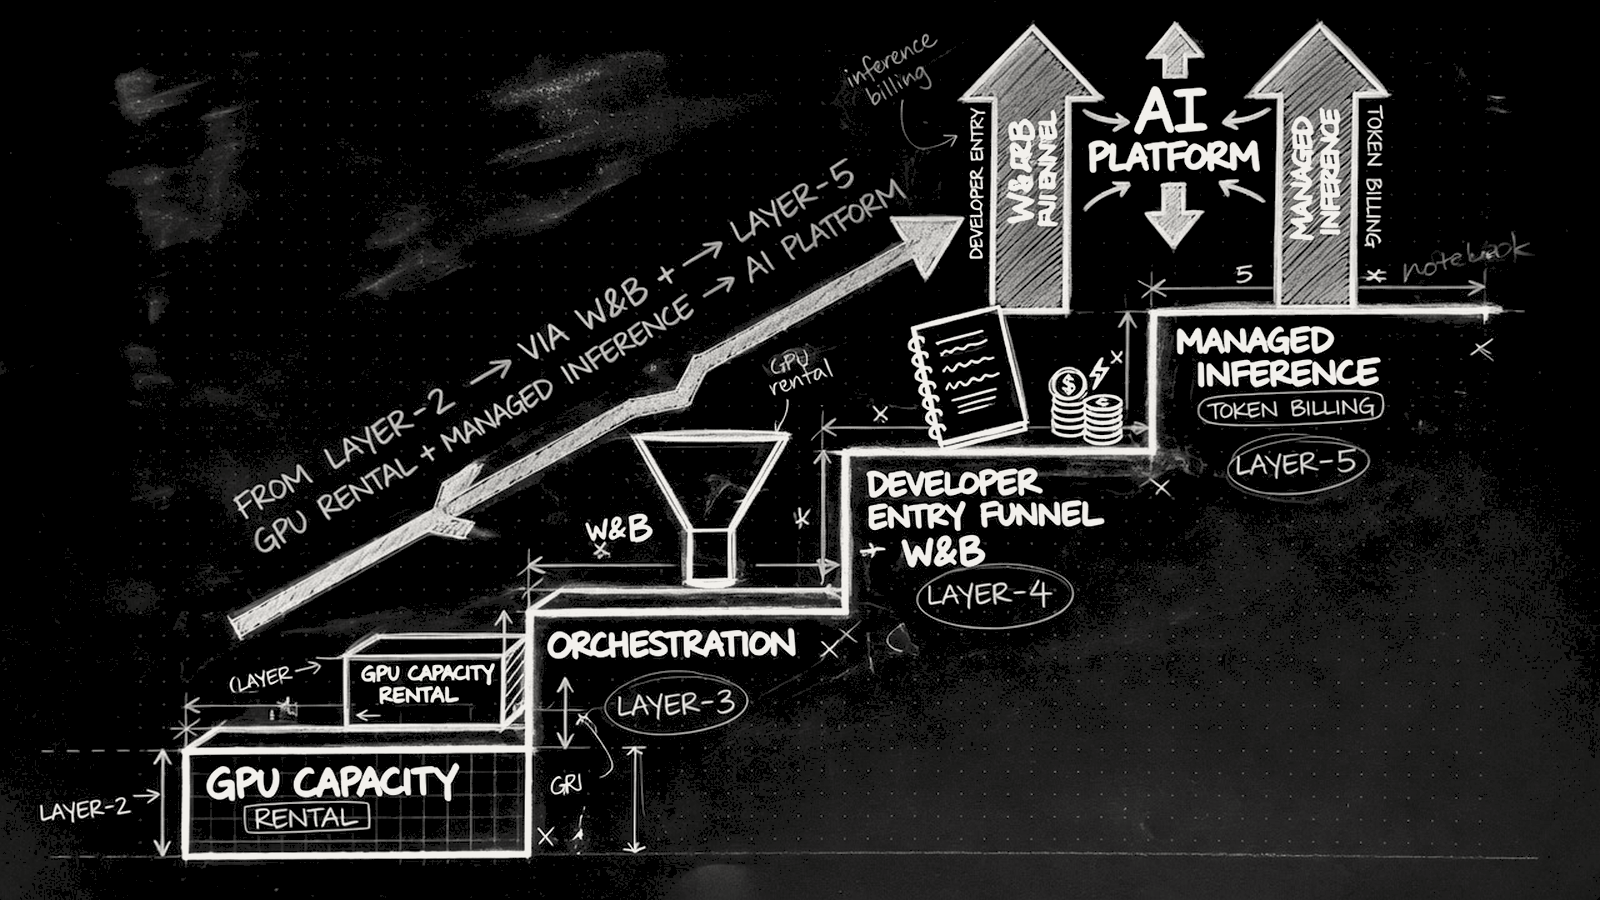
Climb toward L5 before allocation windfall fades

  • W&B $1.0B: developer entry and ML lifecycle lock-in.
  • Managed Inference: from GPU-hour up to token billing.
  • NVIDIA AI Compute Partnership replicates the model to more NeoClouds.
  • In 3–5 years the moat shifts from “get cards” to “ops efficiency + software.”
  • Today’s reality: >99% of revenue still at L2 capacity contracts.
Platform climb from GPU rental to AI platform

Boundary conditions

Success and failure share one condition: GPU scarcity

When the condition holds

Customers race to sign · NVIDIA prioritizes supply · Wall Street funds confidently · flywheel accelerates · platform climb has a time window.

When the condition flips

$47.3B leases do not disappear · $35B interest does not stop · customers reprice/do not renew · cannot sue MSFT · pricing power compresses.

Conclusion

Read CoreWeave as a contract-covered leveraged factory

  • Revenue certainty comes from take-or-pay backlog, not platform network effects.
  • Cost clocks (rent + interest + depreciation) vs revenue events (three-pipeline convergence) is the core risk.
  • Reported gross margin and Adj. EBITDA systematically overstate economic profit.
  • Financing curve has credit-upgraded, but ~$87B obligations still lock 84% of backlog.
  • Software transformation is a direction, not 2026 revenue reality.

Independent research, not investment advice. Data from SEC filings / company IR / public markets. Cutoff: 2026-08-12.